
Introduction to the Break-Even Point
Introduction to the Break-Even Point
What you’ll learn to do: calculate the break-even point, where profit will be equal to $0, using information from financial statements
In this section you will learn to calculate the point where the amount of income you earn results in neither a profit nor a loss—and “breaks even.”
1. Finding the Break-Even Point
LEARNING OUTCOMES
- Define the break-even point
- Differentiate between fixed and variable costs
- Calculate the break-even point
- Calculate the contribution margin
- Calculate the contribution margin ratio
- Calculate the margin of safety
WATCH IT
When can you say a business is good or not? Watch the following video to find out.
You can view the transcript for “Break-Even Analysis – How to Calculate Your Safe Point” (opens in new window) or the text alternative for “Break-Even Analysis – How to Calculate Your Safe Point” (opens in new window).
The Break-Even Point
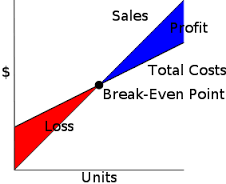
A company breaks even for a given period when sales revenue and costs incurred during that period are equal. Thus the break-even point is that level of operations at which a company realizes no net income or loss.
A company may express a break-even point in dollars of sales revenue or number of units produced or sold. No matter how a company expresses its break-even point, it is still the point of zero income or loss.
In order to grasp the concept of breakeven, it’s important to understand that all costs are not created equal: Some are fixed, and some are variable. Fixed Costs are expenses that are not dependent on the amount of goods or services produced by the business. They are things such as salaries or rents paid per month. If you own a car, then your car payment and insurance premiums are fixed costs because you pay them every month whether you drive your car or not. Variable Costs are volume related and are paid per quantity or unit produced. For your car, your variable costs are things like gas, maintenance, or tires because you only incur these costs when you drive your car. The more miles you drive, the more your gas expenses go up—such costs vary with the level of activity.
Before we turn to the calculation of the break-even point, it’s also important to understand contribution margin.
Contribution Margin
Contribution margin is the portion of revenue that is not consumed by variable cost. In a simple example, if you were to buy a candy bar for 75 cents and resell it for $1, then the contribution margin would be 25 cents—the amount not consumed by cost.
Of course, in business this is generally more complicated. It requires you to understand the variable costs for an item, or those costs that are directly tied to producing a new unit. When selling lemonade from a stand, the costs of the water, lemon juice, sweetener, ice, and serving glass are all variable costs that will recur with each item sold. The cost of the stand is a fixed cost. The labor required to make and serve the lemonade is also generally a fixed cost, as it doesn’t vary based on the number of glasses sold. Let’s look at this in numeric terms, as follows:
| Inputs | Cost | Variable or Fixed? |
|---|---|---|
| Lemons, sweetener, ice, and water | 20 cents per glass | Variable |
| Glasses | 5 cents each | Variable |
| Labor | $100 per day per employee | Fixed |
| Lemonade stand rental | $2,000 per month | Fixed |
If we know that the stand sells 1,000 glasses of lemonade each day at $3 per glass, and that one employee can make and serve 1,000 glasses, then we can calculate the contribution margin.
The cost of raw materials is 25 cents per glass (20 for ingredients + 5 for the glass). If the lemonade is sold for $3 per glass, then the contribution margin is $2.75 per glass.
It’s important to know the contribution margin in order to calculate what portion of the revenue from a product is consumed by the variable costs and what portion can be used to cover, or contribute to, fixed costs.
Breakeven in Units
To illustrate the calculation of a break-even point in units, Video Productions produces videotapes selling for USD 20 per unit. Fixed costs per period total USD 40,000, while the variable cost is USD 12 per unit.
We compute the break-even point in units by dividing total fixed costs by the contribution margin per unit. The contribution margin per unit is USD 8 (USD 20 selling price per unit – USD 12 variable cost per unit). In the following break-even equation, BE refers to the break-even point:

The result tells us that Video Productions breaks even at a volume of 5,000 units per month. We can prove that to be true by computing the revenue and total costs at a volume of 5,000 units. Revenue = 5,000 units X USD 20 sales price per unit = USD 100,000. Total costs = USD 100,000 = USD 40,000 fixed costs + USD 60,000 variable costs (USD 60,000 = USD 12 per unit X 5,000 units).
Note that the revenue and total cost lines cross at 5,000 units—the break-even point. Video Productions has net income at volumes greater than 5,000, but it has losses at volumes less than 5,000 units.
Breakeven in Sales Dollars
Companies frequently measure volume in terms of sales dollars instead of units. For a company such as General Motors that makes not only automobiles but also small components sold to other manufacturers and industries, it makes no sense to think of a break-even point in units. General Motors evaluates breakeven in sales dollars.
The formula to compute the break-even point in sales dollars looks a lot like the formula to compute the breakeven in units, except we divide fixed costs by the contribution margin ratio instead of the contribution margin per unit.

A Broader Perspective: Even Colleges Use Breakeven
The dean of the business school at a particular university was considering whether to offer a seminar for executives. The tuition would be USD 650 per person. Variable costs, including meals, parking, and materials, would be USD 80 per person. Certain costs of offering the seminar, including advertising, instructors’ fees, room rent, and audiovisual equipment rent, would not be affected by the number of people attending. Such seminar costs, which could be thought of as fixed costs, amounted to USD 8,000.
In addition to these costs, a number of staff, including the dean, would work on the program. Although the salaries paid to these staff were not affected by offering the seminar, working on it took these people away from other duties, thus creating an opportunity cost, estimated to be USD 7,000 for this seminar.
Given this information, the school estimated the break-even point to be (USD 8,000 + USD 7,000)/(USD 650 – USD 80) = 26.3 students. If the school wanted at least to break even on this program, it should offer the program only if it expected at least 27 students to attend.
Contribution Margin Ratio
The contribution margin ratio expresses the contribution margin as a percentage of sales. To calculate this ratio, divide the contribution margin per unit by the selling price per unit, or total contribution margin by total revenues. Video Production’s contribution margin ratio is:

The break-even volume of sales is USD 100,000 (5,000 units at USD 20 per unit). At this level of sales, fixed costs plus variable costs equal sales revenue.
In a period of complete idleness (no units produced), Video Productions would lose USD 40,000 (the amount of fixed costs). However, when Video Productions has an output of 10,000 units, the company has net income of USD 40,000.
Although you are likely to use break-even analysis for a single product, you will more frequently use it in multi-product situations. The easiest way to use break-even analysis for a multi-product company is to use dollars of sales as the volume measure. For break-even analysis purposes, a multi-product company must assume a given product mix.Product mix refers to the proportion of the company’s total sales attributable to each type of product sold.
To illustrate the computation of the break-even point for Wonderfood, a multi-product company that makes three types of cereal, assume the following historical data:
| Product 1: Raisin Flakes | Product 2: Sugar Wheat | Product 3: Rice Cereal | Total | |||||
|---|---|---|---|---|---|---|---|---|
| Amount | Percent | Amount | Percent | Amount | Percent | Amount | Percent | |
| Sales | $60,000 | 100% | $30,000 | 100% | $10,000 | 100% | $100,000 | 100% |
| Less: | ||||||||
| Variable costs | $40,000 | 67% | $16,000 | 53% | $4,000 | 40% | $60,000 | 60% |
| Contribution margin | $20,000 | 33% | $14,000 | 47% | $ 6,000 | 60% | $ 40,000 | 40% |
We use the data in the total columns to compute the break-even point. The contribution margin ratio is 40 percent or (USD 40,000/USD 100,000). Assuming the product mix remains constant and fixed costs for the company are USD 50,000, break-even sales are USD 125,000, computed as follows:

[To check our answer: (USD 125,000 X 0.40) – USD 50,000 = USD 0.]
To find the three product sales totals, we multiply total sales dollars by the percent of product mix for each of the three products. The product mix for products 1, 2, and 3 is 60:30:10, respectively. That is, out of the USD 100,000 total sales, there were sales of USD 60,000 for product 1, USD 30,000 for product 2, and USD 10,000 for product 3. Therefore, the company has to sell USD 75,000 of product 1 (0.6 X USD 125,000), USD 37,500 of product 2 (0.3 X USD 125,000), and USD 12,500 of product 3 (0.1 X USD 125,000) to break even.
AN ACCOUNTING PERSPECTIVE: BUSINESS INSIGHT
The founder of Domino’s Pizza, Inc. nearly went bankrupt several times before he finally made Domino’s a financial success. One early problem was that the company was providing small pizzas that cost almost as much to make and just as much to deliver as larger pizzas. Because they were small, the company could not charge enough to cover its costs. At one point, the company’s founder was so busy producing small pizzas that he did not have time to determine that the company was losing money on them.
Margin of Safety
If a company’s current sales are more than its break-even point, it has a margin of safety equal to current sales minus break-even sales. The margin of safety is the amount by which sales can decrease before the company incurs a loss. For example, assume Video Productions currently has sales of USD 120,000 and its break-even sales are USD 100,000. The margin of safety is USD 20,000, computed as follows:
Margin safety = Current sales – Break-even sales
= USD 120,000 – USD 100,000
= USD 20,000
 This means that sales volume could drop by 16.67 percent before the company would incur a loss.
- Introduction to the Break-Even Point. Authored by: Linda Williams and Lumen Learning. License: CC BY: Attribution
- Contribution Margin. Provided by: Lumen Learning. License: CC BY: Attribution
- Practice Questions. Authored by: Nina Burokas. Provided by: Lumen Learning. License: CC BY: Attribution
- Finding the Break-Even Point. Authored by: Roger H. Hermanson, James Don Edwards, Michael W. Maher, John Ivanevich. Provided by: Saylor . Located at: http://www.saylor.org/site/wp-content/uploads/2012/09/TBQ_PA_Accounting_managerial.pdf. License: CC BY-NC-SA: Attribution-NonCommercial-ShareAlike
- Break-Even Analysis - How to Calculate your Safe Point. Authored by: Ducere Global Business School. Located at: https://youtu.be/AsHjjRKeHkg. License: All Rights Reserved. License Terms: Standard YouTube License