Demand
Why Should I Care?
There seem to be rules that govern markets. For example, no one can sell more stuff, than what people are willing to buy. At least not in a free market. This idea of demand – how much people are willing to buy – is at the heart of economics. No factor other than “strong demand” can explain why some products sell for ludicrously high prices while other products collect dust on the store shelves.
This Lecture Has 5 Parts
- Quantity Demanded
- The Law of Demand
- The Demand Model
- Factors Affecting Demand
- Limitations
What is Demand?
Why would a rational adult wait in line overnight and spend more than $500 on a pair of Nike Supreme Dunk Highs? I have no clue.
But it happens. What I can say is that this behaviour is driven by “strong demand”, and it pushes prices to the stratosphere. Understanding demand is the first step in understanding how markets work. The first question economics wants to answer is: Do we have enough stuff? Do we have enough food? Do we have enough clothes? Always remember that quantity is the basic idea in our economic analysis of markets.
On one hand, we will analyze the quantity people want, need, and are willing to buy. This is called demand.
-
Quantity Demanded
Demand is a concept that includes what goods and services consumers would actually buy. Demand also determines how much of these products they would purchase. The concept of demand is narrower than “wants and needs”, which may include things we want, but are not ready, willing, or able to buy. Quantity is the basic idea behind demand. We consume products, not prices.
The concept of demand represents flows of goods and services, because they are consumed over time. Stockpiling is not considered consuming. This is why stocks of goods cannot be used to measure demand.
Our model will want to make a difference between the demand schedule, which includes combinations of prices and quantities for which consumers are ready to empty their pocketbooks, and quantity demanded (Qd), which is the exact quantity buyers are willing to purchase, at a single price.
The same jargon applies to the suppliers. The supply schedule includes many combinations of prices and quantities for which sellers are willing to sell, and quantity supplied (Qs), which is the exact quantity sellers are willing to offer their clients, at a single price.
-
The Law of Demand
Of course the quantity demanded of any product will be determined by the most important factor of all: the price.
Enter price: consumers wish for more quantity of products at lower prices. Economics have graphed out this negative (or inverse) relationship between Quantity and Price, and called it the Demand Curve. Each quantity demanded is associated to a different price. This hypothesis refers to a set of possible, and hypothetical, transactions that buyers would be ready to execute on a specific market. These transactions depend on buyers’ highest possible bids on the market, which is another way of saying reservation (reserve) price. Their highest possible bid is also called their “willingness to pay.”
Imagine the market for Nike Supreme Dunk Highs is composed of only 5 buyers. Let’s assume they will only buy one pair of shoes each, if the price is right. Out of fairness, the price will be the same for all buyers. This said, they each have different preferences, available income, and other reasons for being able to pay certain amounts of money for the shoes.
Table - Buyer's Willingness to Pay for Shoes
|
Buyer |
Willingness to Pay |
|
John |
200$ |
|
Jill |
290$ |
|
Meghan |
125$ |
|
Maude |
75$ |
|
Marc |
175$ |
Given these parameters, how many sneakers would be sold if the sellers’ final ask price was 50, 100, 150, 200, 250, 300 and 350$ ?
At 50$, all five buyers can make a transaction, so you could expect five sales, and a total sales figure of 5 X 50$ = 250$.
At 100$, Maude can no longer buy the shoes. You would expect four sales, and a total sales figure of 4 X 100$ = 400$.
In this example, for every price increase, you lose a buyer. At 300$, all five buyers are excluded and total sales drop to 0$.
Table - Quantity demanded for shoes depends on Seller's Ask Price
|
Sellers’ final |
Quantity demanded |
Total Sales |
|
50 $ |
5 |
250$ |
|
100 $ |
4 |
400$ |
|
150 $ |
3 |
450$ |
|
200 $ |
2 |
400$ |
|
250 $ |
1 |
250$ |
|
300 $ |
0 |
0$ |
|
350 $ |
0 |
0$ |
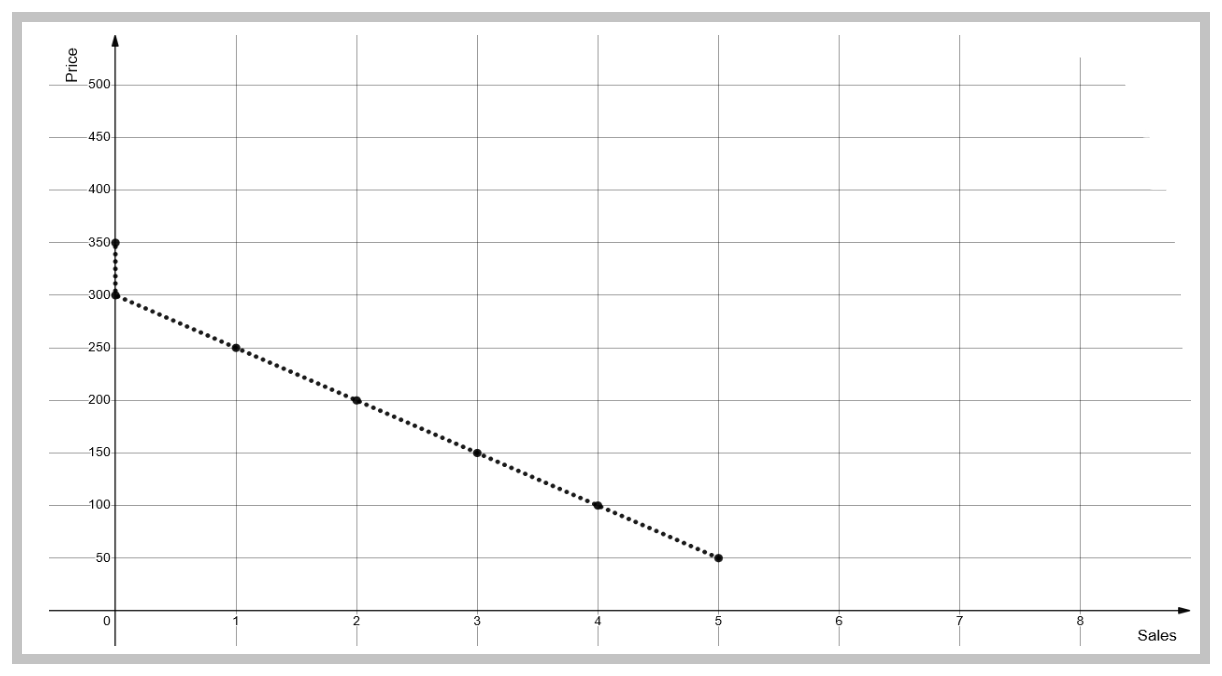
As you can see on the following graph, the higher price reduces the number of potential buyers on the market. Those who are not willing to pay as much money, and those who are not so rich, are boxed out of the market.
Graph - Frequency of purchases depends on Price.
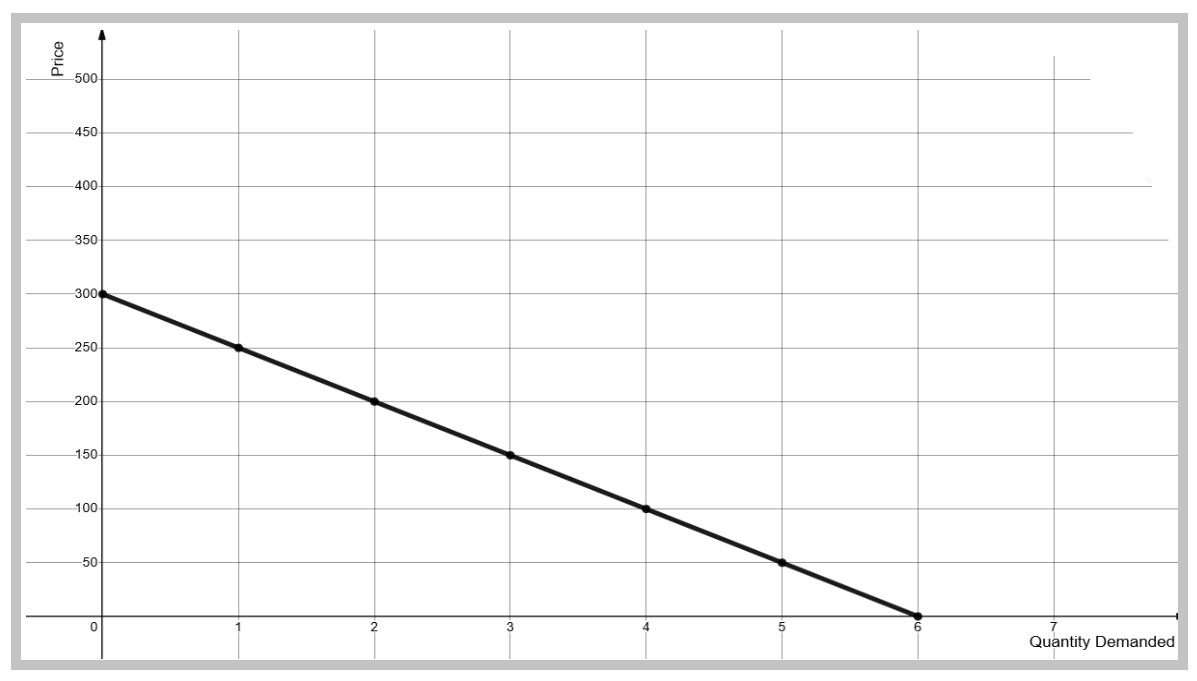
You might be wondering why the Price variable is on the vertical axis. Usually, the independent variable would be on the horizontal axis. This would tell the same story. Placing the price on the vertical axis was first done by Marshall, and is thus common practice in economics, even if it is the independent variable in this case. Again, on this graph, we can see that a lower price increases the potential for the number of sales. Assuming a constant relationship, you can draw a line across the dots and call it a demand curve.
Graph - Demand Schedule for Shoes
The demand curve represents a fundamental principle of economics. This relationship is called the Law of Demand.
If all else is equal, lower prices bring higher sales, and vice-versa.
In mathematical terms, Quantity demanded is a negative function of Price Qd = f (P)
If Price INCREASES, then Quantity DECREASES.
If Price DECREASES, then Quantity INCREASES.
Economists strongly believe that in most cases, and most times, quantity demanded is inversely related to prices. This Law of Demand means that when all the other factors are held constant, price increases will reduce quantities demanded on the market, and vice-versa.
Why? Three reasons:
Market Size:
Some people will become buyers only when price goes down.
Purchasing Power:
Each person may buy more units if price goes down.
Substitution:
People will compare prices with other goods (substitutes), and change their purchases accordingly.
To isolate the relationship between price and quantity, economists keep other variables constant. This is why any statement in economic modelling starts, or ends, with the phrase “all else equal.” The Latin version is also widely used: Ceteris Paribus.
Economists will call Price an “endogenous” variable, because it is part and parcel of our model of explaining quantity demanded. This way, the price variable will always be related to quantities, and will shift with quantities when an outside, or “exogenous”, variable changes.
Notice that some people will get to buy the product for less than their willingness to pay. This is a form of profit for the consumer, who is left with extra money in his wallet. We call this consumer surplus.
-
The Demand Model
Definitions
-
- Demand represents how much quantity consumers are actually willing and able to buy of a product at a given price.
Assumptions
-
- People use money, not barter, to trade.
- The product is a non-differentiated commodity.
- People would rather have more of a product, than less.
- Higher prices lead to lower quantities demanded.
- Lower prices lead to higher quantities demanded.
Hypotheses
-
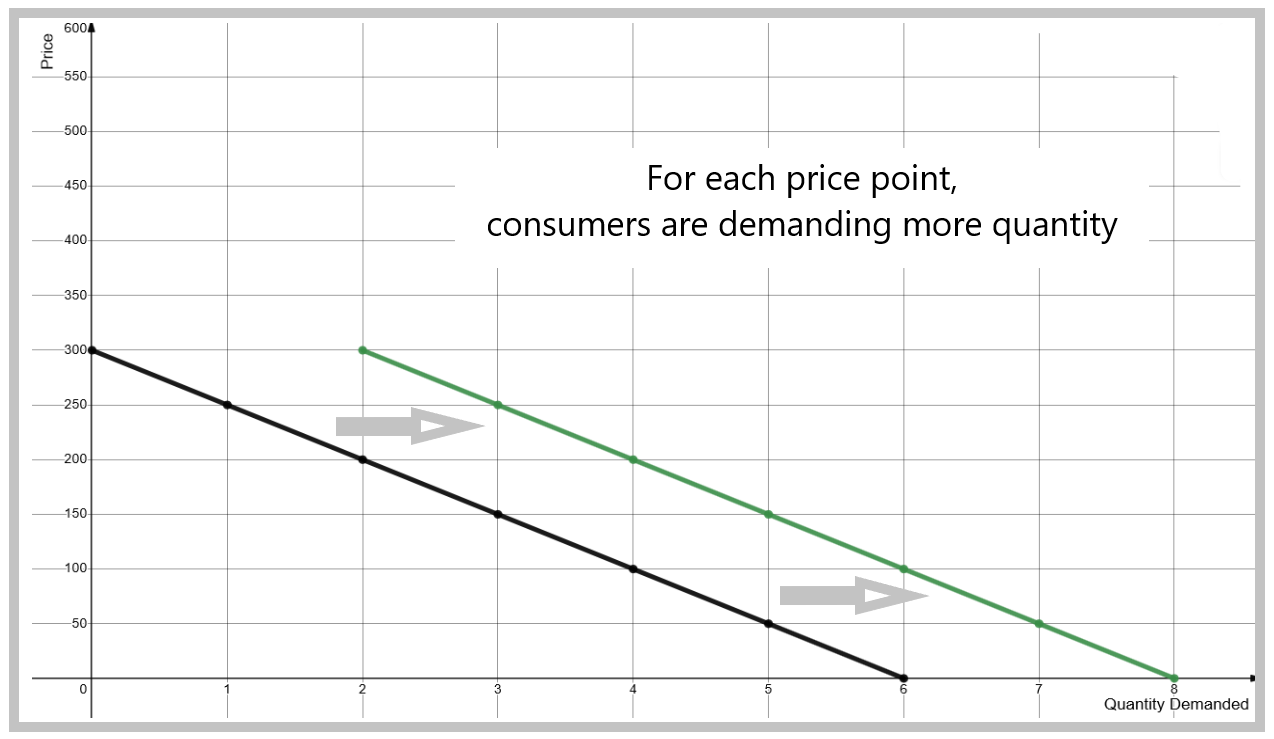
- If demand increases, consumers will buy more for the same price.
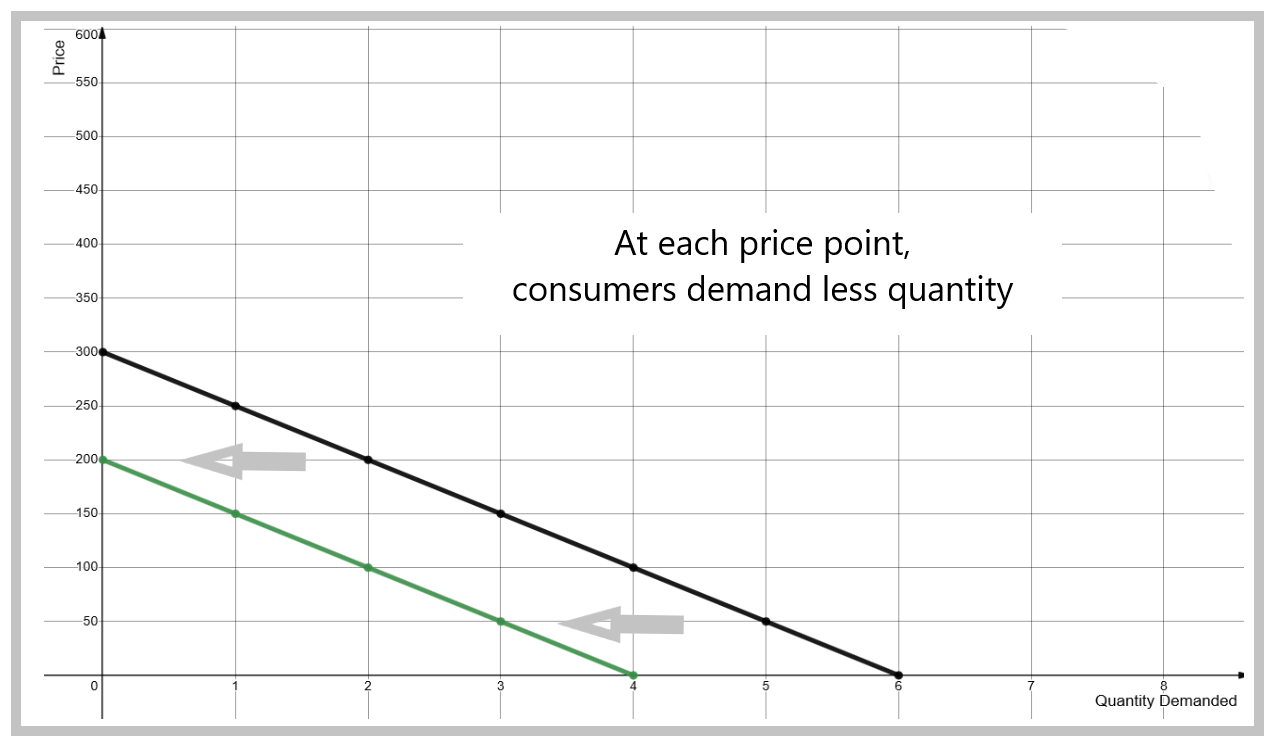
- If demand decreases, consumers will buy less for the same price.
Predictions
-
- A change in demand will change the market conditions for goods and services, and may lead to shortages or surpluses.
- Suppliers may be able to charge higher or lower prices depending on the level of demand.
The model distinguishes Demand (D) and Quantity demanded (Qd).
Demand is a negatively-sloped curve. It represents possible transactions at different price and quantity combinations.
Quantity demanded is one of the points on the curve. Each point represents one combination of price and quantity.
-
Factors Affecting Demand
If you were a footwear retailer, or an executive at rival company Adidas, would you want to know why demand can be so strong for a product such as the semi-ugly Nike Supreme Dunk Highs?
Economists list the following factors affecting demand. These are “exogenous” factors, which affect demand from outside the economic model we are building. We can call these factors the external environment to the system. These factors are not on the graph for supply and demand.
Trends, Tastes, and Preferences
When Michael Jordan signed with Nike, the footwear world changed forever. Having them featured in a Spike Lee movie, and by Jerry Seinfeld, also helped. Seeing Jordan win 6 championships and break so many records turned him into a living god. Of course, Nike Air Jordan became the most sought-after basketball sneakers on the market.
Changes in Personal Income
When people have more money, they tend to spend more money. When they have less money, they tend to spend less as well. If you lose your job, maybe you shouldn't waste your money on fancy shoes.
Changes in Population
An increase in population can come from having more births, an increase in life expectancy, or immigration. Demographic changes will create more or less demand for all products.
Expectations
New York City skateboard retail store Supreme hit the nail on its head with its creative artwork and partnerships with sneaker companies. Since the shoes are designed by artists, and produced in small quantities, they are considered to be potentially collectible items. On expectations of a higher price later on, people are willing to speculate on this product.
Price of Complement Goods
Sometimes, two objects are purchased together. For example, if you bought a collector's version of a sneaker, you might also be on the market for a special case. If the shoes happened to be more affordable than you had expected, you suddenly have more money for that case. If you are buying shoes to play basketball on the neighbourhood court, you are going to need socks as well. We are often influenced to make a purchase by the price of the complement good, but I don't think you would be 500$ shoes because the socks were on sale.
Price of Substitute Goods
More often than not, there exists a substitute good for whatever we are interested in purchasing. In this case, look up the Air Jordan 2 "Eminem 313". I am sure you will agree, it's not the same thing at all, but if you had to wear shoes, they might do the job.
When these factors impose themselves on the market, they are said to shift the demand curve. For example, if there is more demand for shoes due to a change in trends (fashion), the demand curve will shift to the right. If the factor is reducing demand, the curve will shift left. Always shift along the horizontal axis that represents Quantity demanded. This is because these factors are affecting the market irrespective of prices. For analysis purposes, we want to isolate their effect, so we will keep prices constant, and all other factors constant as well (Ceteris Paribus).
Graphing a Shift in the Demand Curve - More Demand
Graphing a Shift in the Demand Curve - Less Demand
-
Limitations
The most important limitation of the demand concept is that most points are hypothetical, and – at best – based on loose estimates. The only point of a demand curve which is based on factual data is the price-quantity combination where actual market transactions occur. We call this point revealed quantity demanded.
Another limitation is the fact the model does not account for quality issues associated to a price increase or decrease. In many cases, expensive products tend to be higher quality than inexpensive products. For this model to hold, the product must therefore be a perfect commodity, which is rather rare.
A third limitation is that the market process is based on a single price, which every seller (the askers) must conform to. In reality, it is possible to shop around and see that some sellers are asking much less than others for the same product.
A final limitation is that sometimes the Law of Demand does not apply. Sometimes a price that is too low might send the wrong message to buyers, that the product has very little value and is not worth buying at all. Lower prices may be associated to lower sales, all else equal. The same effect can exist with prices that are high, they might attract more buyers, who value the signalling effect of a high price relative to quality, or to exclusivity.
Wrap-Up
The theory of markets analyzes whether or not firms are providing consumers with enough products. One side of the story is demand from consumers.
The theory of demand sorts out the reasons demand can be strong or weak. The demand curve represents people buying more when prices drop. They also buy less of a product, when its price increases.
Prices have to cover the lowest cost of production. But they can be higher than that, and this is usually due to the level of demand.
Cheat Sheet
Willingness to Pay:
A buyer’s highest possible bid for a product, which must be equal or less than his reserve price, and can be equal or higher than the market price.
Demand:
A negatively-sloped curve that represents a buyer’s hypothetical transactions at different prices.
Quantity demanded:
A point on the Quantity axis that is associated to a potential price.
References and Further Reading
Lovewell, M. (2009). Understanding Economics, A Contemporary Perspective, Fifth Edition. McGraw-Hill Ryerson.
Mankiw, N. G. (2008). Essentials of Economics, Sixth Edition. Cengage Learning.
Marshall, A. (1890). Principles of Economics.


