
Labour Markets Analysis
Why Should I Care?
Labour market outcomes are one of the most important aspects of the economy, This determines whether people have jobs, and money, to pay their bills and afford a quality life style. Using supply and demand analysis, we can draw simulations and better inform policy makers of what to do when labour issues arise.
This Chapter Has 6 Parts
- Scenario
- Supply and Demand
- Labour Surplus: Unemployment
- Labour Shortage: Vacancies
- The Case For and Against Minimum Wage
- Unions and Sticky Wages
What is Labour Markets Analysis?
Labour markets are one type of resource markets, or factor markets. Other factors include land rents, capital interest, and entrepreneurial profits. Each of these markets are important because they determine income streams, and act as a cost of production. An important note here is that households are not necessarily demanders on the factor markets, especially the labour market. Households represent the labour supply, and firms represent the labour demand.
The quantity of labour depends on the type of analysis, and the type of employment discussed. The price for labour is the wage, whose unit of measurement should be coherent with the quantities implied. For example, if we are measuring the number of workers per year, then the price should be annual wages. If we are measuring the number of hours worked per week, we should match these figures to an hourly wage.
-
Scenario
Scenario
Different countries will have different issues relative to their labour markets, depending on their population growth trends. Remember there are three ways to increase your population, either with more births, a longer life span, or immigration.
|
Country |
Qd (hr/mth) |
Qs (hr/mth) |
Gap |
Market condition |
Wage adjustment |
Labour force |
|
|
|
StoneLand |
500 |
600 |
100 |
Surplus |
W down |
600 |
100 |
100/600 |
|
CatWorld |
890 |
760 |
-130 |
Shortage |
W up |
760 |
0 |
0/760 |
|
OrangeVila |
1,187 |
1,254 |
67 |
Surplus |
W down |
1,254 |
67 |
67/1254 |
The country of StoneLand is in a surplus market condition because the supply of workers (600)600 h/m) is larger than the demand from employers (500)500 h/m). The unemployment rate is especially high, at 16.7 percent. In a free market for labour, with no unions or wage restrictions, you could expect the wages to decrease. Let's see what this looks like on a graph.
Graph

According to the graph, a wage of 25 dollars per hour would be the reason for the unemployed. If wages came down to 24 dollars, employers would increase their quantity demanded for labour to 550 h/m, and households would reduce their quantity supplied to 550 h/m, which would clear the market.
Of course there are issues of trust in employers to actually increase employment, and not their profits, which undermine such an argument. The solution might also be to stimulate productive investment, to create employment, rather than reduce worker income.
Let's see what a labour shortage looks like on a graph.
Graph

As you can see, the issue is unfilled positions. The employers of CatWorld are ready to hire 890 hours/month, but there are only enough workers to provide 760 h/m. Free market forces would see the wages increase, from 23 to 24 $/h and employment settle at more or less 800 h/m. Notice the unemployment rate would still be zero, as it cannot be negative.
The market for labour in OrangeVila is in a slight surplus, with an unemployment rate of 5.3 percent. This might be frictional unemployment in which case wages would probably not be under any market force to adjust. The market here is cleared.
-
Supply and Demand
Let's see what this looks like on a table and on a table and a graph.
Supply and Demand Schedule for the StoneLand Labour Market
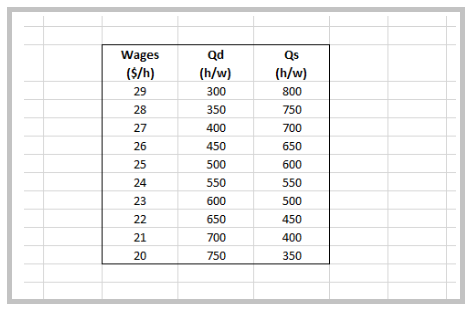
Supply and Demand Graph for the StoneLand Labour Market
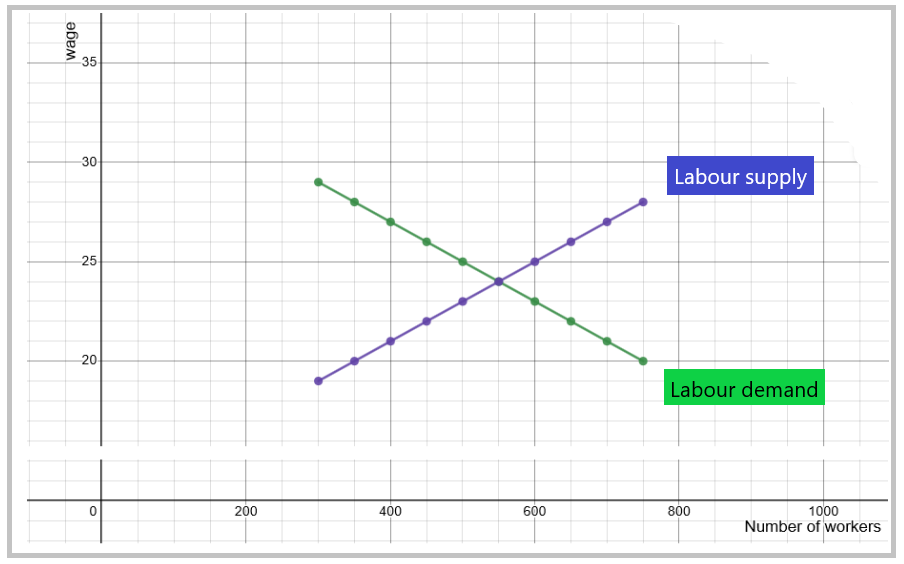
As you can see on the graph and the table, the equilibrium wage would be 24 dollars per hour, and would clear markets with 550 hours per week. Consider a part-time job would be 10 hours per week, that would represent about 55 persons. If the jobs are full time 40 hour weeks, then this would represent 13.75 full-time positions.
-
Labour Surplus: Unemployment
We can easily see the situation of unemployment as a surplus of labour supplied to the market. In this case quantity supplied by households is greater than quantity demanded by firms.
In the case of StoneLand, a situation where Qs = 600, and Qd = 500, equates to a labour surplus of 100 hours per week. This represents about 10 part-time jobs, or 2.5 full-time positions.
Graph - Labour Surplus
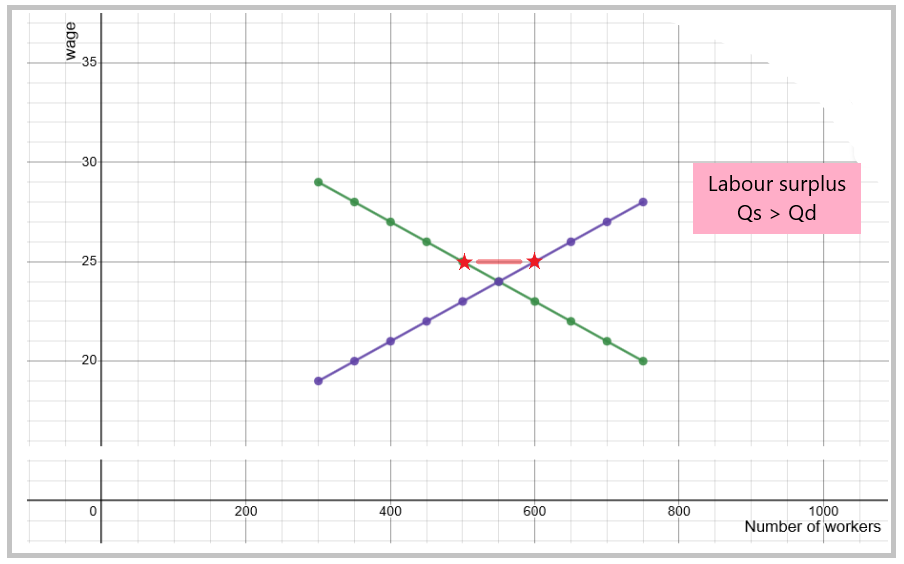
Classical economists would suggest that wages should drop to solve the problem. In this case, a lower wage, at 24 dollars per hour, would increase the quantity of labour demanded by firms, and decrease the quantity of labour supplied by households.
-
Labour Shortage: Vacancies
We can easily see the situation of labour shortages as a shortage of labour supplied to the market. In this case quantity supplied by households is inferior to the quantity demanded by firms.
In the case of StoneLand, a situation where Qd = 600, and Qs = 500, equates to a labour shortage of 100 hours per week. This represents about 10 vacant part-time jobs, or 2.5 unfilled full-time positions.
Graph - Labour Shortages
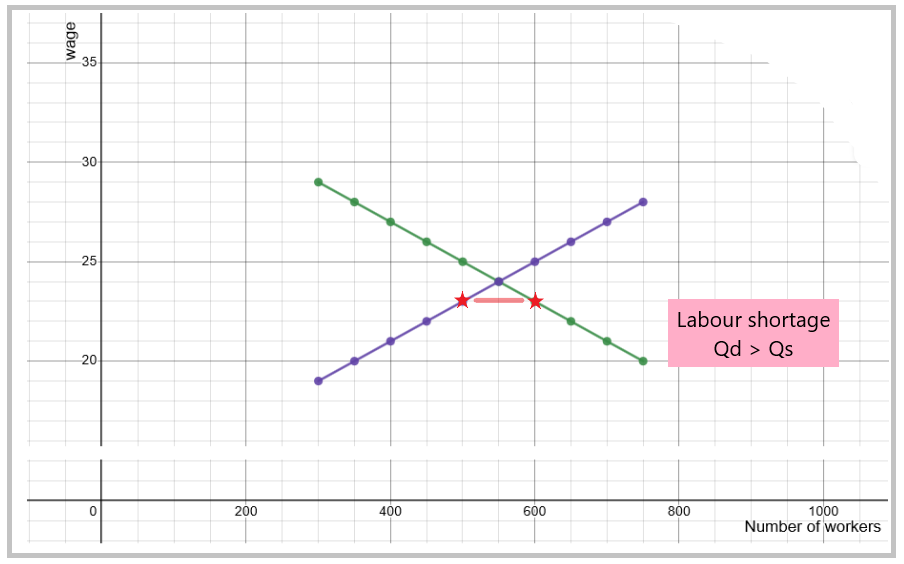
Classical economists would suggest that wages should increase to solve the problem. In this case, a higher wage, at 24 dollars per hour, would increase the quantity of labour supplied by households, and decrease the quantity of labour demanded by firms. Note that the gap between Employed (500), and Quantity demanded (600), is not made up of humans, or hours of work, but of unfilled positions. The social consequences of labour shortages are really not as dire as those of unemployment, which affects people rather than paperwork.
- The Case For and Against Minimum Wage
Minimum wage is a policy that fixes a wage floor, whereby everyone in the economy must be paid more than the regulated floor. In Canada, the minimum wage is up to each province. In Quebec, the minimum wage is 15.25 $/hour. The lowest wage is paid in Saskatchewan (14.00 $/h), and the highest is paid in British Columbia (16.75 $/h) (source: https://www.retailcouncil.org/resources/quick-facts/minimum-wage-by-province/).
This policy should not be analyzed in terms of its effect on the average wage in Canada, since most workers are being paid well above the minimum wage. The policy actually only applies to those workers who might be paid less. Once the policy is in place, it becomes hard to tell how many people would benefit from this policy.
On a graph, the floor is illustrated by a horizontal line that sits above the market wage, for bottom earners. The point of minimum wage is to increase the income of workers at the very bottom of the social hierarchy. So the wage must be set above the market wage set by supply and demand. It then looks like a situation where unemployment is being created, because firms who can't afford to pay workers the minimum wage are moved out of the labour market.
Graph - A left-wing simulation in favour of minimum wage
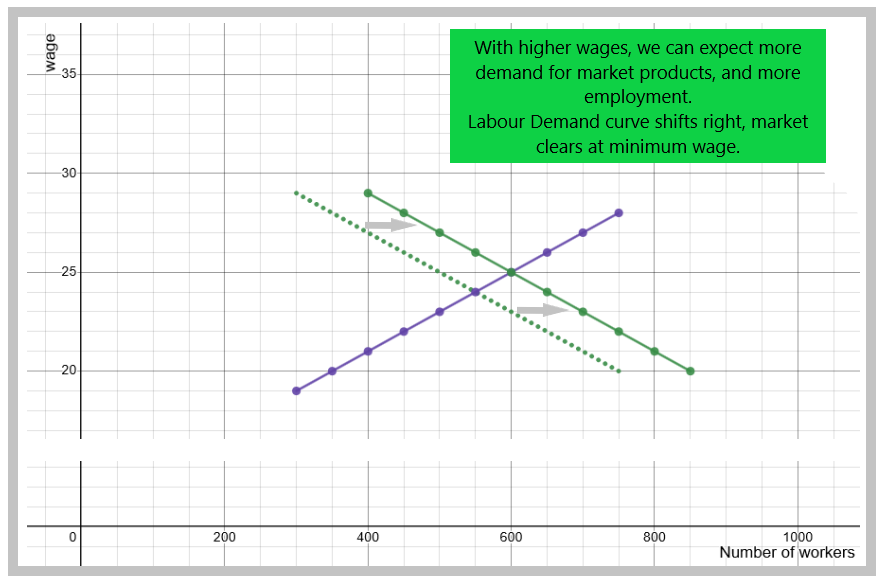
These graphs are useful to illustrate a phenomenon, which is rather complex given the multitude of variables involved. This helps to clarify one's ideas and thoughts about the issue. However, one needs to consult empirical evidence to see who is right, the classical economists who don't like minimum wage because it increases the cost of production, or the left-wing economists who see it as a way to redistribute income to the working poor.
If you would like to read some empirical evidence on this, we recommend the work of David Card, Joshua Angrist and Guido Imbens who won the 2021 Nobel prize in Economic Sciences. These economists used natural experiments, such as a sudden change in the minimum wage of the state of New Jersey, in 1992, and used the neighbouring state of Pennsylvania as a control group, where the minimum wage was not changed. Card, a Canadian economist teaching at UC Berkeley, found no increase in unemployment due to the change. Angrist and Imbens are credited for their methodological work related to natural experiments. Thanks to their work, hundreds of studies have been done to better measure the effects of minimum wage, but also education, and immigration, on labour outcomes.
-
Unions and Sticky Wages
Unions are forms of collective labour representation. When workers form a union, they agree to a single contract for everyone, rather than individual negotiations with the employer. Each worker will have the same pay, and will know how much others are earning. Unionized work allows for labour strikes as a tool for collective bargaining.
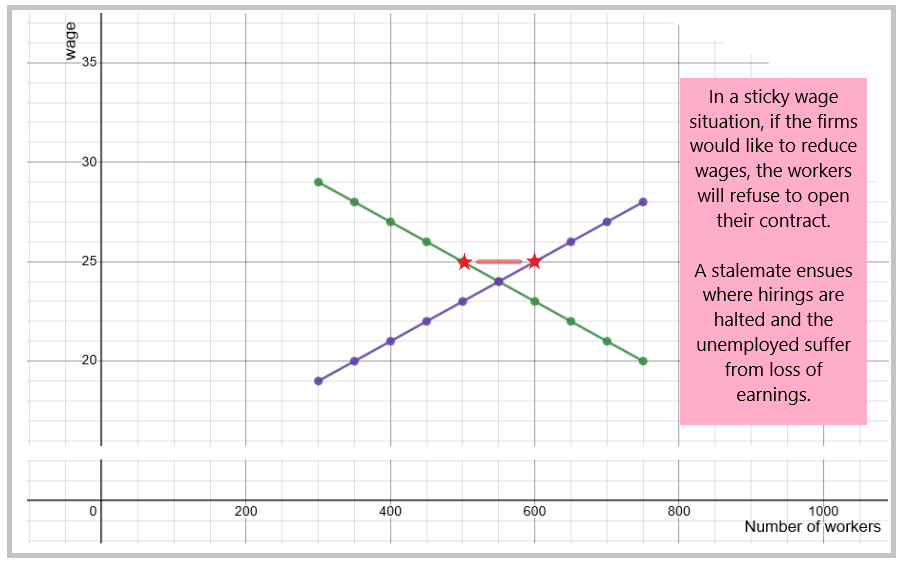
The economic consequences of having unions are numerous. One consequence is that wages cannot be adjusted quickly, they require waiting for the contract term to run out, and then to sit at negotiations between management and union leaders. Thus, we say that wages become sticky, they won't come down, or up, to help clear the labour market.
One reason why workers choose to unionize is the lack of trust that can arise between the workers and management, or even ownership of the firms. In a situation where ownership is organized as a non-profit, or a cooperative, management tends to negotiate openly with its workers. In a situation where workers own part, or the whole, of the firm, again management tends to get along with workers. Labour disputes usually arise when workers suspect the owners of the firm of hoarding important profits, which could have been paid out to the workers instead.
If management proposes to reduce wages, they may accompany this demand with a promise of hiring more workers. Most labour movements would be distrustful of this argument. They would probably believe the owner will pocket the lower wages as a cost savings, and improve the profit margin of the firm.
In the case of sticky wages, markets would not clear with a wage adjustment. In this case you would have lingering disequilibrium between quantities supplied and demanded.
To be fair, wages are usually stickier if management is asking to reduce them. Workers would probably agree to renegotiate their collective agreement if the owner is offering generous wage increases.
Graph - Sticky wages
References and Further Reading
Fredriksson, P., Mörk, E, and Svensson, J. (2021). Natural experiments help answer important questions. Committee for the Prize in Economic Sciences in Memory of Alfred Nobel. https://www.nobelprize.org/uploads/2021/10/popular-economicsciencesprize2021-2.pdf