Self-Regulating Markets
Why Should I Care?
Economists believe that free market prices are very rich and subtle information signals, which enable markets to make better decisions than the government or an expert committee could. That feedback allows markets to self-regulate, which is neat.
This Lecture Has 5 Parts
- Equilibrium
- Surplus
- Shortage
- Comparing Monopoly and Perfect Competition
- Principles
What is a Self-Regulating Market?
Anyone who operates on a truly competitive market knows that there are unspoken laws that you have to abide by. Not laws of the State, but unwritten laws of the market forces. These laws of supply and demand impose certain behaviours. Buyers can't force sellers to lower prices below cost. Sellers can't fix prices above the market level. Sellers can't produce more than buyers are willing to purchase. Buyers can't buy if sellers won't produce.
When free and open markets work well, they are generally stable and any irregular behaviour from suppliers or demanders is not sustainable. The market will bring prices and production levels back to the equilibrium of supply and demand. Markets that clear without government intervention are said to be 'self-regulating', which is nice because there are lots of things to manage and coordinate. If markets can coordinate themselves, it avoids having to ask politicians to get involved in day-to-day economic activities like making sure there are enough groceries in your pantry.
Marshall's model uses a single price to clear the market. In this model, every buyer and seller must conform to the same price for everyone. Other models may allow each buyer to negotiate individual prices. The consequence of this assumption is important. Most people will consider that a market is competitive if you can go to another buyer or seller to get a better deal. In this model, that is not possible, because in the end, everyone pays the same price. Everyone is always working in a simulated environment with one price for all, at any given time.
-
Equilibrium
Perfect competition in markets generates prices and quantities autonomously, fairly, and in a stable way. In this ideal situation, regular folk can’t blame anyone for high prices or shortages of goods in daily life. It is actually everyone’s and anyone’s “fault” if prices change abruptly.
This is the equilibrium: a level of production where demand and supply are equal in price and quantity. At this price point, neither suppliers nor demanders will pressure a change in quantities and prices. In this situation we say the market has cleared.
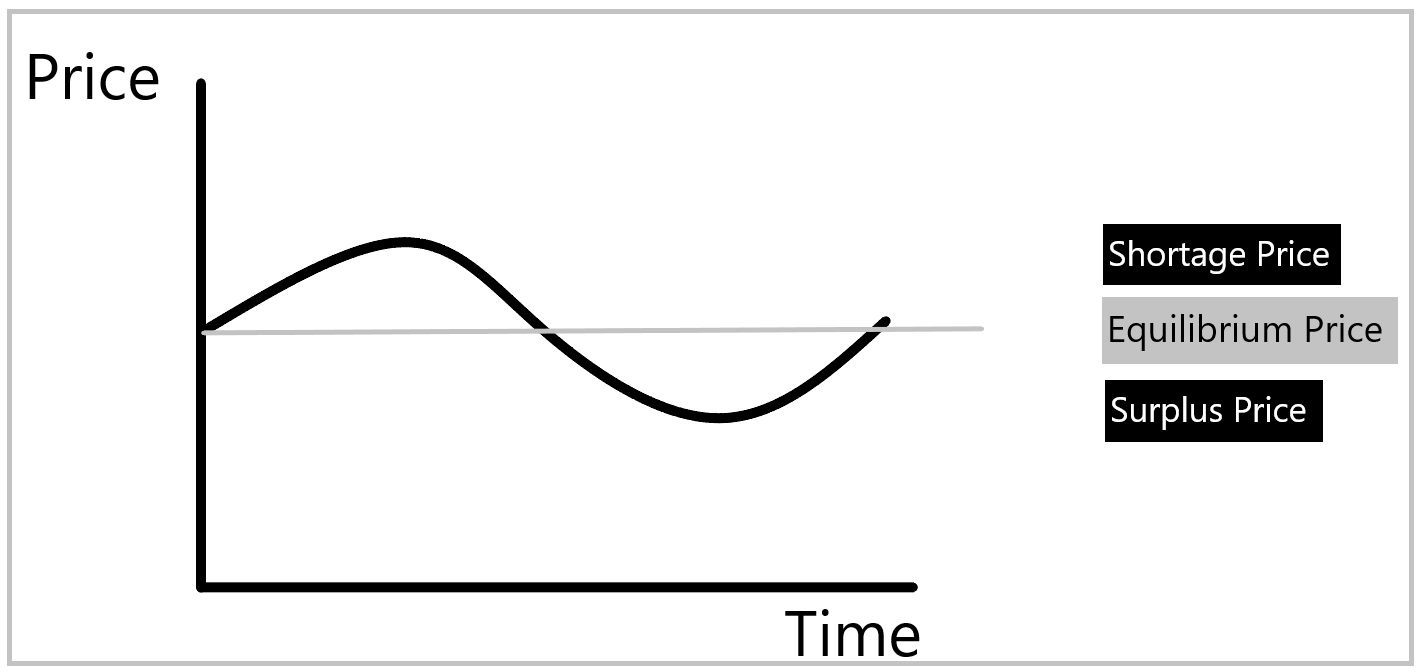
The technical reason for equilibrium is that markets act as a negative feedback loop.
When prices are too low, this creates a surplus of unsold quantities. Suppliers increased their inventories and increased their orders of new product. When the surplus is very real for consumers, there is too much product for sale. Prices will come down in an effort to liquidate unsold production.
When prices are too high, this creates a shortage of unproduced quantities. Suppliers reduced their inventories and decreased their orders for new product. When the shortage is very real for consumers, there is not enough product for sale. Shelves are empty and lineups show up in front of stores. Prices will come back up as sellers auction off the limited supply.
Graph - Evolution of self-regulating prices over time
In a shortage, one of the key reasons why high prices come back down is that most products are not unique, and they can be easily replaced by something else. For example, if the price of ice-cream becomes too high, buyers will flock to another market, such as “freeze pops”, or cookies, and leave producers stranded with unsold inventory. This is called the substitution effect. It is very strong and shortens the delay back to the equilibrium.
The main reason however for prices to move is that inventories of supply are too low, or too high, as opposed to market demand. The price acts as a feedback for information. If markets are in a surplus condition, sellers will want to reduce prices to liquidate excess inventory. When markets are in a shortage condition, sellers will want to increase prices, which stimulates production upstream of retailers. When you analyze markets using this model, you must identify the market condition first, then apply the proper feedback, which is a price variation, then see how sellers and buyers react independently to the new price.
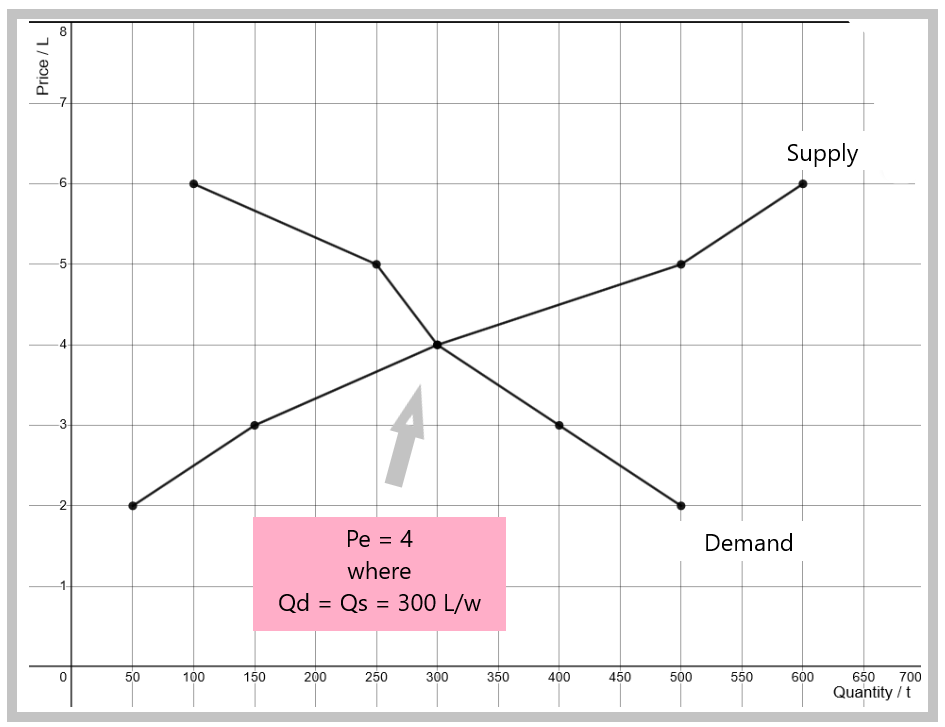
As you can see in the table below, equilibrium in VillageTown would be obtained at a price of 4 dollars per 1 litre tub of ice-cream (Pe). In this case, the quantity demanded would be 300 litres per week, and the quantity supplied would also be 300 litres per week. In this case, we say that the market has cleared, because there is no gap between supply and demand.
Supply and Demand Schedule for VillageTown Ice-Cream Market
|
Situation |
Price ($/L) |
Qd/w (tubs) |
Qs/w (tubs) |
Gap |
|
A |
6 |
100 |
600 |
500 |
|
B |
5 |
250 |
500 |
250 |
|
C |
4 |
300 |
300 |
0 |
|
D |
3 |
400 |
150 |
-250 |
|
E |
2 |
500 |
50 |
-450 |
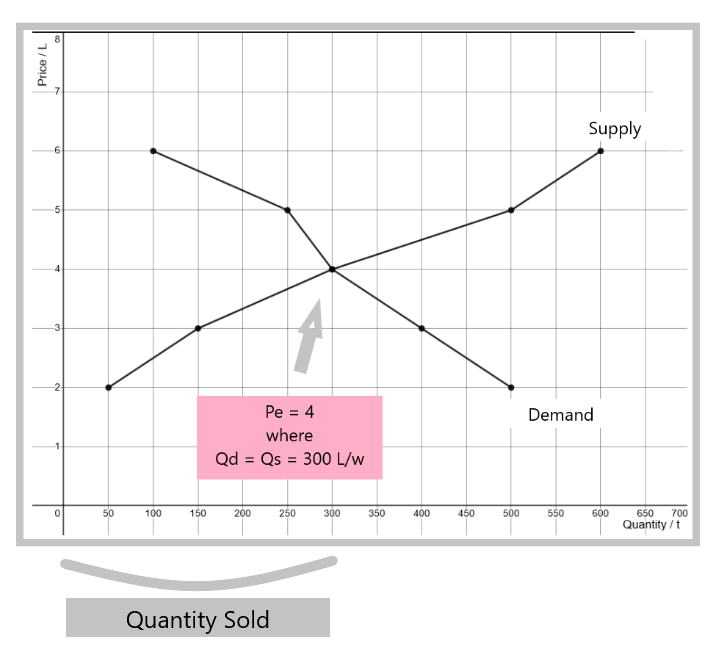
On the graph, you can see that the equilibrium position is where both curves cross, at coordinate (300, 4).
Equilibrium for Ice-Cream in VillageTown
Notice the quantity sold in competitive equilibrium is more important than in the other situations of surplus or shortage. It is also more important than the quantity supplied in a monopoly scenario.
-
Surplus
A surplus is a market condition where the level of production is too high for the actual demand for that product.
If car makers produce too many compact sedans than they can sell, there will be a surplus of these vehicles. The market’s reaction to a surplus: the cars go on sale and production is slowed.
In supply and demand analysis, quantity supplied is greater than quantity demanded. The gap between these points represents the surplus. The theory predicts that producers will halt production until inventories come back to regular levels. The price will fall because producers are numerous and do not control prices. As quantity supplied decreases, Qs slides on the supply curve towards the left.
On the demand curve, a high initial price is associated to low sales. Quantity demanded represents insufficient demand to buy all the goods on the market. As prices come down, sales increase: Qd slides on the demand curve towards the right.
Scenario
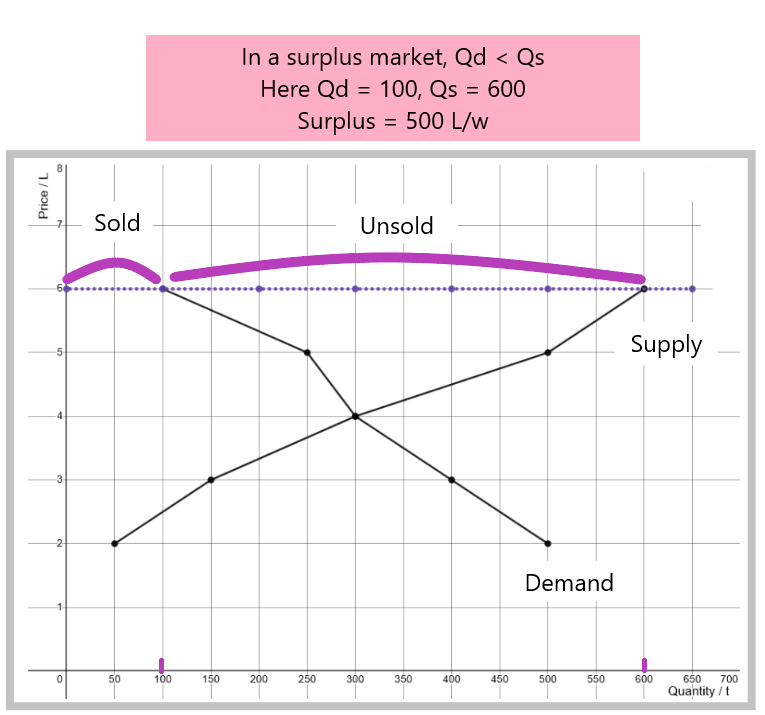
The suppliers of VillageTown have all gone crazy and decided to produce way too much ice cream. The ladies tell us they were enthused because the price of ice-cream on the market was 6 dollars per tub. Since Grandma Jones can't control here friends, and maybe everybody is feeling a little greedy, production increased to 600 tubs per week. As you can see on the schedule below, this market condition is a surplus, with an excess production of 500 tubs/week. Note that you can't sell more than Qd, so that the sales are only 100 tubs per week. Remember that buyers don't like higher prices, so their quantity demanded retracted when the price went up to 6 dollars.
Supply and Demand Schedule for VillageTown Ice-Cream Market
|
Situation |
Price ($) |
Qd/w (tubs) |
Qs/w (tubs) |
Gap |
|
A |
6 |
100 |
600 |
500 |
|
B |
5 |
250 |
500 |
250 |
|
C |
4 |
300 |
300 |
0 |
|
D |
3 |
400 |
150 |
-250 |
|
E |
2 |
500 |
50 |
-450 |
You can see the same information on the graph below. At 6 dollars a tub, Qs is much larger than Qd.
Surplus for Ice Cream in VillageTown
This market is in a surplus market condition. This means that inventories are too high. You will see this in terms of fully stocked shelves in the store. The manager will have a better idea be they know how much stock is also in the back, and in the warehouse. To sell excess production, stores will reduce prices. Stores will advertise rebates, promotions, and sales. If you look at the table and graph, at 5 dollars, there is still a surplus, but it's much less of an issue. At 4 dollars, Qd equals Qs (300 tubs/w), and there will no longer be market forces influencing a price change.
-
Shortage
Shortage is not to be confused with scarcity. All products are subject to the Problem of Scarcity, but that does not mean there are always shortages. Wants and needs are infinite. But demand is not. Demand is limited by your preferences and your budget. Markets would never clear if demand was infinite.
A shortage is a market condition where the level of production is too low for the actual demand for that product. If bakers do not produce enough bread to feed the masses, this is called a shortage of bread. Regular people know and have seen the market’s reaction to a shortage: prices increase dramatically and people become upset because this makes them poorer. Their incomes are not usually rising at the same pace as prices.
In economic theory, shortage is explained when quantity demanded is greater than quantity supplied. Assumptions of the model predict the price has to rise because producers are numerous and do not control prices. High prices will convince producers to increase production. They will directly benefit from increased sales. As quantity supplied increases, Qs slides on the supply curve towards the right.
On the demand curve, a lower initial price is associated to high sales. Quantity demanded therefore represents very strong demand to buy all the production on the market. As prices rise, sales decrease: Qd slides on the demand curve towards the left.
Scenario
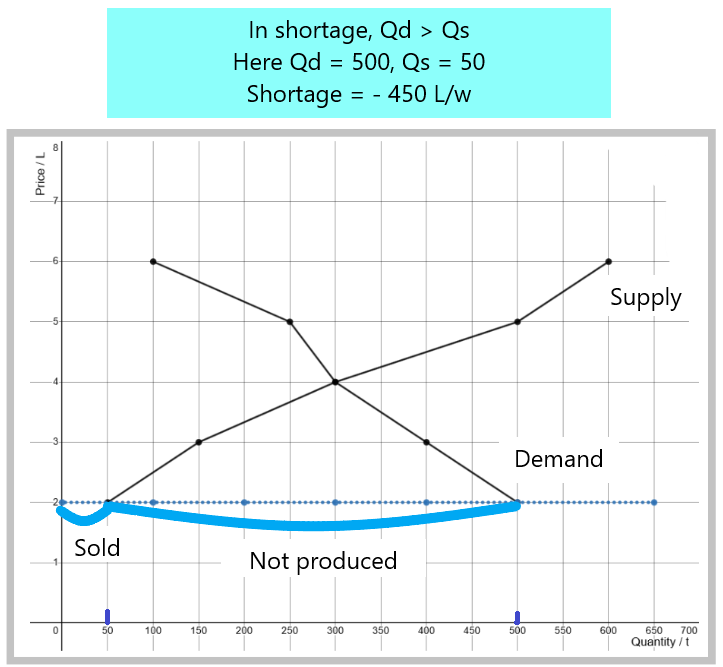
The suppliers of VillageTown have gone crazy and make way too little ice cream. The ladies tell us they were frustrated because the price of ice-cream on the market was 2 dollars per tub. Since Grandma Jones can't control her friends, and maybe everybody is feeling a little insulted by the ridiculous price, production decreased to 50 tubs per week. As you can see on the schedule below, this market condition is a shortage, with a lack of production of 450 tubs/week. Note that you can't sell more than Qs, so that the sales are only 50 tubs per week. Remember that buyers love lower prices, so their quantity demanded increased when the price dropped to 2 dollars, but they can't buy what hasn't been produced.
Supply and Demand Schedule for VillageTown Ice-Cream Market
|
Situation |
Price ($) |
Qd (tub/w) |
Qs (tub/w) |
Gap |
|
A |
6 |
100 |
600 |
500 |
|
B |
5 |
250 |
500 |
250 |
|
C |
4 |
300 |
300 |
0 |
|
D |
3 |
400 |
150 |
-250 |
|
E |
2 |
500 |
50 |
-450 |
You can see the same information on the graph below. At 2 dollars a tub, Qd is much larger than Qs.
Shortage for Ice Cream in VillageTown
This market is in a shortage market condition. This means that inventories are too low. You won't see excess product on the shelves. Rather, the opposite. The shelves are going to be empty, and you are going to see lineups at the store. Stores will increase prices. If you look at the table and graph, at 3 dollars, you still have a shortage, but it's much less of an issue. At 4 dollars, Qd equals Qs (300 tubs/w), and there will no longer be market forces influencing a price change.
-
Comparing Monopoly and Perfect Competition
Now that we have presented both the Monopoly situation, and the Perfect Competition situation, we can compare them. In a monopoly scenario, there is no supply curve. The monopolist decides the price and quantity supplied combination that suits it the best. The monopolist can't sell more than Qd, so basically, the monopolist will hover on the demand curve until the quantity-price combination maximizes its revenues. Whatever the quantity produced, it is equal to Qd, so that a monopoly situation is always in equilibrium. If demand shifts, the monopolist will adjust back to equilibrium.
Simply put, in the case of a monopoly, the market share of the firm is 100%. A monopolist would prefer producing the whole lot of production, than just a share, of say 25 or 40 percent of the market.
Right off the bat, we can assume a new monopolist would be happy with a price-quantity combination that had been set by a previously competitive market. The initial situation is to go from 40 percent of the market to 100 percent. But becoming a monopoly is often costly. Buying out competitors often increases a company's debt and investors are expecting a return on the investment. Being the only game in town now, the monopolist is not obligated to follow previous practices. Depending on the slope of the demand curve, on how sensitive people are to an increase in price, the monopolist will find it convenient, and lucrative, to reduce quantities, and increase prices.
As a rule, the monopoly price is generally higher than the competitive market price. No one would build a monopoly to reduce the price of a product. Let’s compare the two situations with numbers.
Scenario
The following table shows the demand and supply schedules for Ice-Cream in VillageTown. In this example, the shape of the demand curve, and its intersect with supply creates an opportunity for a monopoly to be formed. This opportunity depends on the slope and position of both curves. If the competitive equilibrium maximizes sales, then there will not be an economic rationale to create a monopoly.
|
Situation |
Price ($) |
Qd (tub/week) |
Qs (tub/week) |
Q Sold |
Max Sales (P x Lesser Q) |
Max Sales |
|
A |
6 |
100 |
600 |
100 |
6 X 100 |
$600 |
|
B |
5 |
250 |
500 |
250 |
5 X 250 |
$1,250 |
|
C |
4 |
300 |
300 |
300 |
4 X 300 |
$1,200 |
|
D |
3 |
400 |
150 |
150 |
3 X 150 |
$450 |
|
E |
2 |
500 |
50 |
50 |
2 X 50 |
$100 |
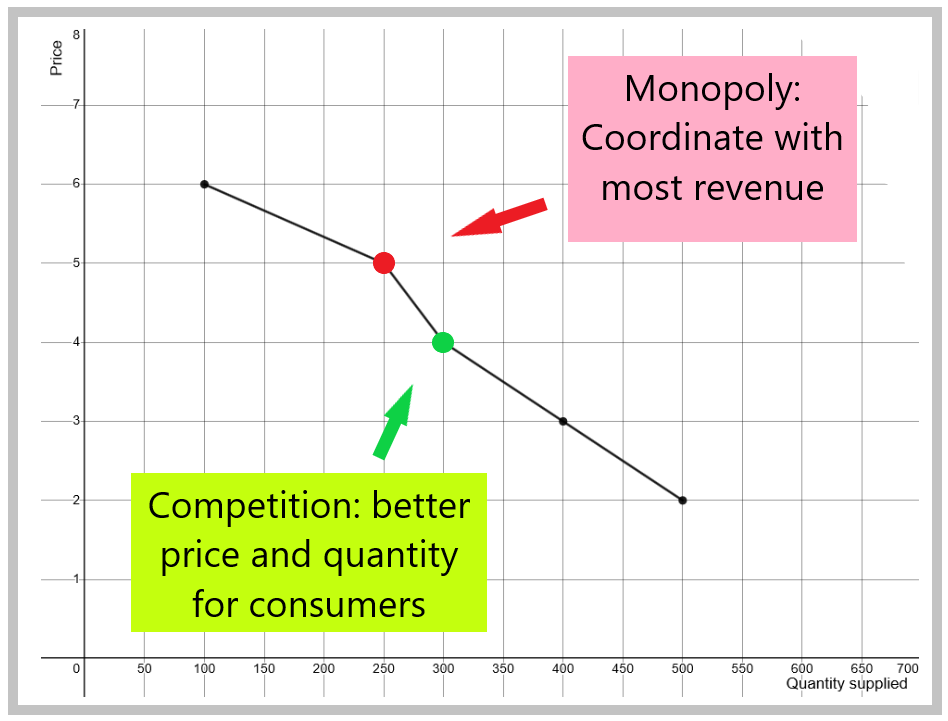
You can see from the table that the highest revenue option is B, at 1,250$ per week. This is only possible in a monopoly scenario, because if there was competition, the surplus condition would reduce the price back down to 4 dollars and production down as well.
You can also see from the table that the highest possible level of production is 300, which is possible only with the competitive market. The market price is also 4 dollars, which is better than 5$ in a monopoly.
It is obvious that the monopoly situation only benefits that producer.
Also consider that in the case of Perfect Competition, producers have to 'share' the market. At a lower price of 4$, a 40 percent market share is worth 480$ per week. In the case of a Monopolist, the producer has 100% of the market, which is worth 1,250$, thanks to a higher price of 5$. The monopolist gets more than double the business, and produces less product than the competitive industry.
On the graph, the monopoly supply position is shown with the red dot (250q, 5$). The perfect competition supply position is given by the intersection of the supply and demand curves (300q, 4$).
Graph - Comparing Monopoly and Competition in Village Town
-
Principles
Positive:
- A single price can clear markets, where quantities demanded and supplied are equal.
- At equilibrium, both suppliers and demanders agree on quantities to be produced, and price.
- At equilibrium, suppliers’ profits are not excessive, and demanders have also sacrificed some of their consumer surplus.
- At equilibrium, quantities sold are the maxima.
- At equilibrium, total sales may not be the maxima.
Normative:
(Right-wing)
- Regulators should leave markets alone, as these institutions are self-correcting and do not lead to surplus or shortage production levels.
- Regulators should encourage more competition as this maximizes quantities produced and consumed.
(Left-wing)
- Regulators should NOT set the desired quantities, based solely on the free-markets’ ability to clear markets.
- Societies should have a say in which products are “bads”, and whose consumption should be banned, or limited. Also holds for quality, labour safety, health, and environmental issues.
- Societies should have a say in which products need to be abundantly produced and freely distributed to ensure public welfare, such as clean air, water, housing, clothing, food and arts.
Wrap-Up
Under perfect competition, markets clear autonomously. This is because prices act as a self-regulating feedback.
In perfect competition, prices always revert quantities back to the equilibrium level of production, which means a mismatch between supply and demand is not sustainable in the long-run.
Market conditions can deteriorate to a surplus (demand < supply), or a shortage (demand > supply). But this situation will generate a change in prices that will force buyers and suppliers to come back to the equilibrium situation. The presence, or not, of substitute goods greatly influences these “market forces”.
The predicted outcome is that markets set prices at an equilibrium that respects both demand and supply relationships. An equilibrium is autonomous, fair, and stable. But it remains a theoretical outcome.
Cheat Sheet
Equilibrium:
A market condition where quantity supplied equals quantity demanded.
Surplus:
A market condition where quantity supplied is greater than quantity demanded.
Shortage:
A market condition where quantity supplied is insufficient for quantity demanded.
Equilibrium:
A steady-state combination of price and quantity where demand equals supply.
Perfect Competition:
A theory that states that producers cannot influence the price or quantity of products, which are set by the open-market.
References and Further Reading
Stiglitz, J. E., & Walsh, C. E. (2006). Economics, 4th edition. New York: W. W. Norton & Co.

