
The Circular Flow of Money
Why Should I Care?
What you do affects other people. The money you spend on clothes, music, and food, is reused in the economy and becomes income for other people. This cycle is important to understand as it emphasizes both the power and the fragility of the economic system.
This Lecture Has 5 Parts
- Markets
- Circular Flow of Money
- Limitations
- What is Macroeconomics?
- Principles
What is the Circular Flow of Money?
The economic system is powerful. Using the profit incentive, the system generates complex production of useful, and sometimes not-so-useful, goods and services. Unfortunately, the flow of production is very often linear. Once a resource is extracted, it is transformed into a product, and then consumed. Its waste goes to landfill, and other forms of pollution, all to often.
But what happens to the money used to purchase that product? Once you have paid for your good or service, the money is no longer in your hands. Yet it has not disappeared. That money will recirculate in the economic system.
A basic concept to grasp is the “circular” aspect of flows of money in the economy. Most people use money to buy things on all kinds of different markets. The spent money becomes income for the seller. The seller will then buy something for himself and the circle continues. Markets are interlinked.
It seems humans understand flows of money to be circular since… we don’t know how far back. It is almost impossible to be specific as to when human beings started to understand the circular flow of money that seems so prevalent in market economies.
Charting this flow helps us understand how the economy works. As you remember, a system is made of many components, many of which are discussed here: inputs, outputs, processor, and feedback.
Since this model looks at the whole system (economists use the term macroeconomics), it is a very useful starting point to discuss aggregate measurements of the economy. Thanks to the Circular Flow of Money diagram, we can situate and understand measurements of the Labour Market, of Money and its use in total production, Gross Domestic Product. Circular Flow of Money allows us to visualize the relationship between the accumulation of stocks, and the flows of material production. The model does not address the measurement of Inflation, but it does help us understand the role of purchasing power for consumers, as a large group in the system.
-
Markets
There are many kinds of markets in the economy. We will try to draw a simple representation of the economy by identifying only two kinds of markets, for now, as they relate to two types of objects.
First, we must agree there is a group of markets where people can buy and sell resources, also called factors of production. We will call these the factor markets. These are markets for resources, where producers meet those who own land, labour, and capital to buy resources in order to produce goods and services.
Second, there is a group of markets where final production is bought and sold. These are the product markets, where regular people meet with producers to buy goods and services intended for final consumption.
This distinction between factors and products is important as both households, and producers, need to use both markets. They don’t always behave the same way on each market. For example, the notion of competition differs depending on the type of market.
For example, on the product market a company like Bombardier might have competition from other private jet plane makers such as Boeing.Beechcraft, PlaneDassault, buyersCessna, willEmbraer, haveGulfstream, toHonda, chooseNextant, between these two companiesPiaggio, and others.Pilatus.
But Bombardier does not have to fight these foreign companies on the local Canadian labour market. BoeingMost makesof planesthe plane makers are in the USAUS, andEurope inor Brazil. When Bombardier seeks highly skilled labour for its plants in Montreal, and Toronto, it will compete for this valuable resource with other manufacturers, such as Pratt & Whitney Canada, which runs a large engine plant in Longueuil, Qc. On the product market, Pratt and Bombardier do not compete. Pratt actually cooperates with Bombardier because it makes some of the engines that power Bombardier jets. But both companies are in competition when it comes to resources such as machines, tools, robots, electronics, metals, plastics, and labour.
Also note that the circular flow model disregards all production which eludes markets. If you build your own cabin, if you grow your own vegetables, if you barter your bicycle for a set of winter tires, if went fishing and brought back 100 trouts, etc... all of this economic activity is not included in the model because it was out-of-market, or non-monetized. The production can only be measured in quantities, not money, because there weren't prices. Keep this in mind when you learn about GDP and inflation later.
-
Circular Flow of Money
To explain how the economy works, economists have long relied on the Circular Flow Diagram, which officially first appeared in textbooks about 100 years ago. Ironically, we still don’t know who created it, though. This is a theoretical model that will help us understand who the actors of the economy are, what they do, and how they are interdependent. This model is a simple introduction to macroeconomics, in that it presents flows of sums of money (aggregates).
Model – Circular Flow Diagram
- Definitions
- Households are people that own resources such as labour, capital, land and entrepreneurship.
- Firms are organizations run by people who use resources to make products.
- Resources are sold on the Factor Market.
- Products are sold on the Product Market.
- Assumptions
- Households do not save, pay taxes, or buy imports.
- Households spend all their money on products.
- Firms spend all their money on resources.
- There is no government or taxes.
- There are no banks.
- There are no imports or exports of production.
- Hypotheses
- If anyone’s spending decreases, this will result in lower production levels. And vice-versa.
- Predictions
- Households’ spending on products is equal to producers’ spending on resources.
- Households’ income from resources is equal to producers’ income from product sales.
- The economy is in a steady-state.
Diagram - Circular Flow of Money
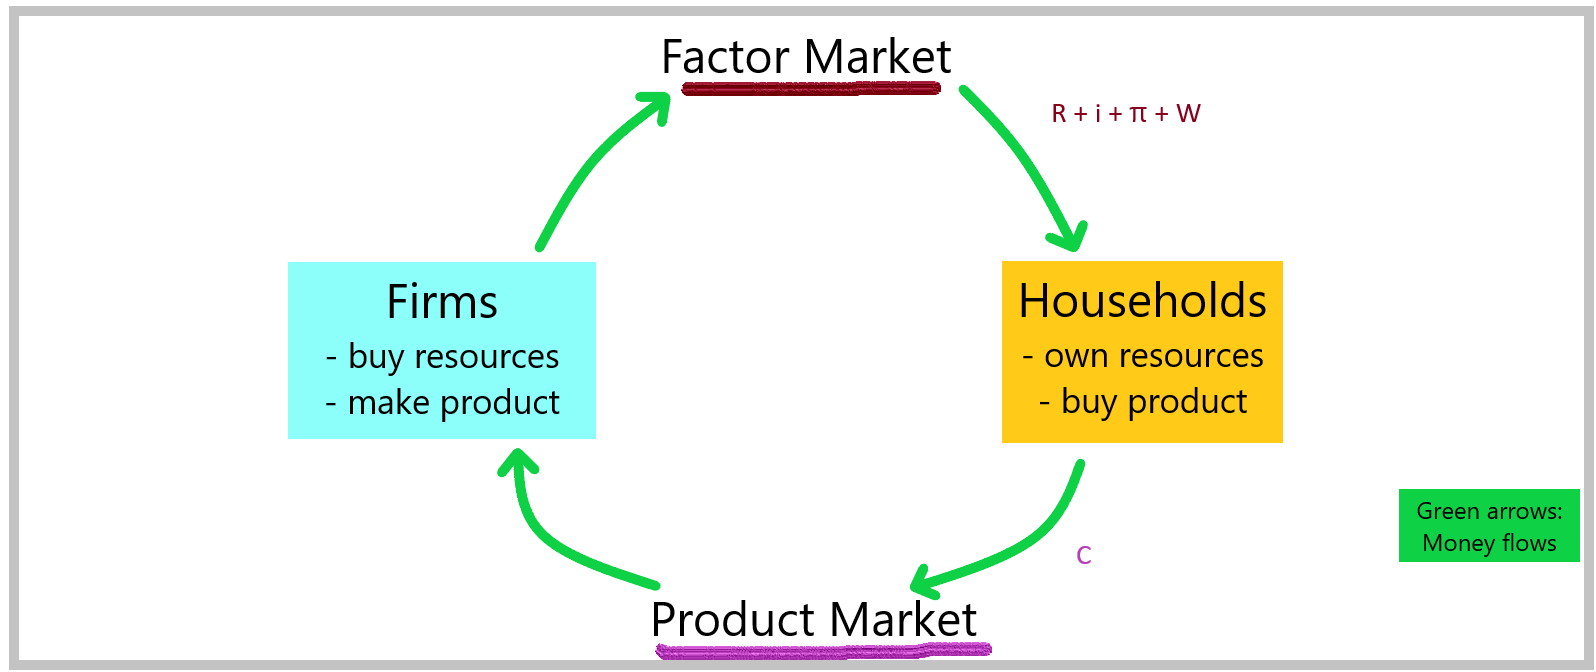
In its essence, the Circular Flow Diagram is a model of flows of both matter and money, from one stock of matter to another. Imagine that there are stocks of resources sitting in the homes of households. Everyday, a certain amount of that stock is transferred to organizations that produce output. That transfer happens on the Factor Market and is called a flow. Each of the resources is associated to a flow of money, which we can measure as aggregates. In the table below, you see the example of the resources used on a farm. The flow of labour is called wages and salaries. The flow of Land is called Rent. The flow of Capital is Interest. Usually, financial capital (loans) are used to buy physical capital (machines and factories), so they both end up being measured in the flow of interest. The flow of Entrepreneurship is measured in Profits.
Once the stocks of resources are in the hands of the producers, or Firms, they are transformed into stocks of Goods and Services, and in the case of goods, they sit in warehouses. As they are sold on the Product market, these stocks of product can be measured as flows of product. We categorized them in different ways. In the Keynesian approach, we categorize the products depending on the type of buyer. If they were purchased by consumers, we call it Personal Consumption. If they were purchased by investors, we call it Investment. If they were purchased by the State, we call it Government Spending. In the table below, you can see that the resources used to produce farm output, food, were used to buy a house, a car, groceries, get a few hair cuts, and health care.
Diagram - Circular Flow of Money with Output
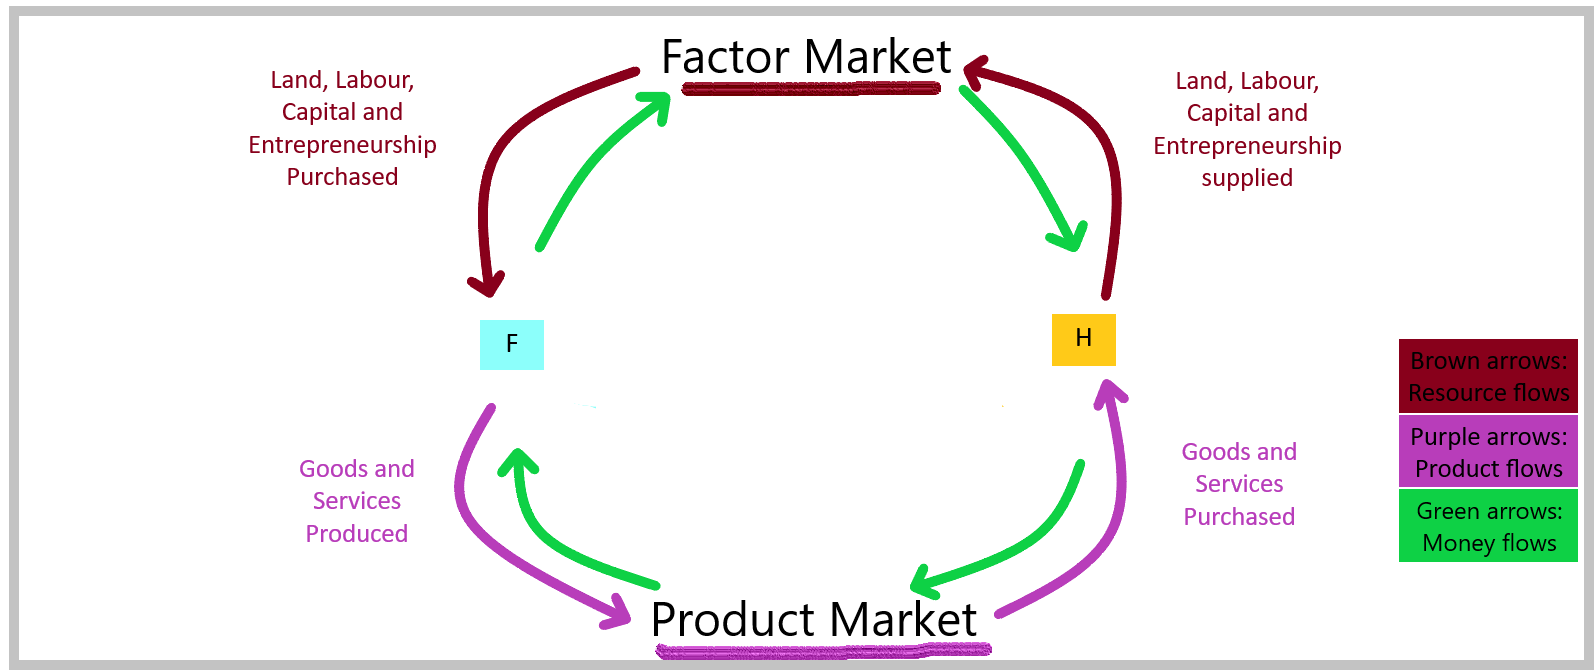
Table - Stocks and Flows on a Farm
| Example of an Object |
Stock (Q) |
Flow (Q/t) |
Market ($/t) |
| Work |
Labour |
Wages |
Factor |
| Farmed field |
Land |
Rent |
Factor |
| Loan |
Financial Capital |
Interest |
Factor |
| Dividend |
Entrepreneurship |
Profit |
Factor |
| Tractor |
Physical Capital |
Interest (if financed) |
Factor |
| Automobile |
Durable Good |
Personal Consumption |
Product |
| Health Care |
Service |
Government Spending |
Product |
| Hair Cut |
Service |
Personal Consumption |
Product |
| Groceries |
Non-Durable Good |
Personal Consumption |
Product |
| Residential Mortgage |
Service |
Investment |
Product |
INTERPRETATION
The circular flow diagram is useful in showing a few things.
A) Actors are interdependent (Inputs = Outputs)
B) The factor market sets the “cost-price” of production, or accounting cost
C) Costs for firms are also income streams for households
D) The sum of income must equal the sum of spending
E) To visualize the relationship between the stocks and flow of resources, and stocks and flow of product.
The model also allows us to identify several aggregates which we can use to measure the macroeconomy. For example, the number of available workers, or labour, is useful for understanding issues related to unemployment, and wages. Since it is an important resource, labour issues are also monitored using total wages, which directly affects household's spending power, also called consumption.
Other resource income streams include rent, associated to land, interest, associated to capital, and profits, associated to entrepreneurship. On the expenditure side of the model, flows of money can associated to the actor involved, i.e. personal consumption (families and households), government spending (public institutions), and investment (investors).
Total streams cannot be added up together, since someone's income, is the same money used for their spending. Hence, the sum of incomes on factor markets should equal the sum of expenditures on product markets.
Aggregate measurements
| Resources | Income | Expenditure | Actor |
| Factor Market | Product Market | ||
| Labour | Wages | Personal consumption | Private households |
| Land | Rent | Government | Public institutions |
| Capital | Interest | Investment | Investors |
| Entrepreneurship | Profits | ||
| Sum of Income = | Sum of Spending |
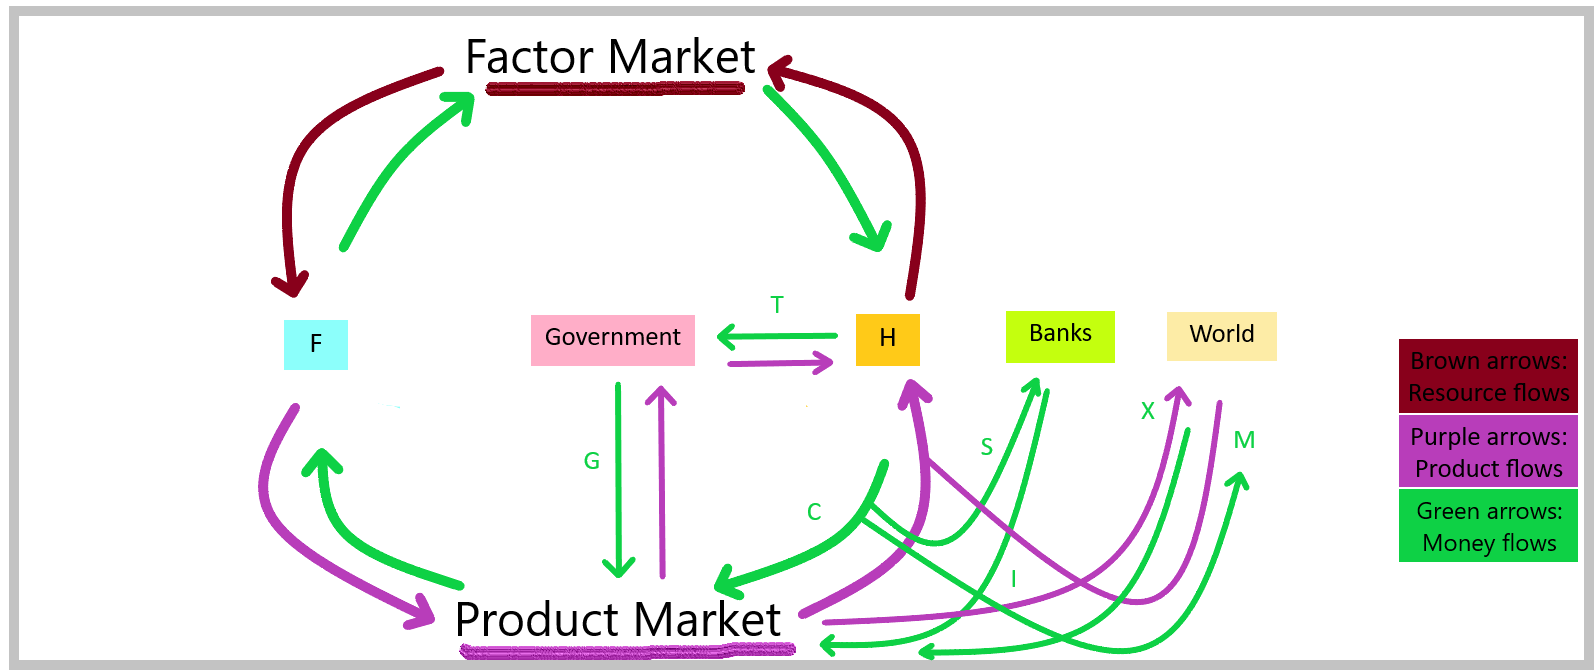
A more complete model including leakages
The simple model assumes that money circulates without interruption. We know this is not true of the material aspect of the economy. Many outputs, especially BADS, are not used as inputs, they are wasted in the natural environment.
It may also be possible that the monetary cycle is diminished by leakages, such as imports forfrom other countries, savings that reduce consumption, and taxes imposed on households. We can accomodate for these leakages by including them in the model. Each leakage comes with its parent injection, so the model holds if the sum of the leakages equates to the sum of the injections.
Table of Leakages and Injections
| Sector |
Leakage |
Injection |
| Foreign |
Imports (M) |
Exports (X) |
| Banking |
Savings (S) |
Investment (I) |
| Government |
Government Procurement (G) |
Taxes (T) |
Diagram - Complete Model
-
Principles
Positive:
Economic actors are interdependent.
Actors are present on both factor and product markets.
The sum of income equals the sum of spending.
Normative:
Capitalists should avoid reducing wages as it reduces firms’ sales revenue on product markets.
Regulators should avoid leakages from the circular flow, which leads to lower economic activity.
Workers should spend their money to allow for other economic activities.
-
Limitations
This model has many limitations. First of all, this simple version of the model has no savings, no taxes, and no exports. This can be remedied by adding boxes and arrows for these economic actions.
Second, it gives the impression that final goods and services are magically transformed into raw resources. True, some resources are “renewable”, such as labour, and hydro-electricity. But most resources are not, such as coal, and wood. Most products cannot be reintroduced into the production flow because they disappear once they are consumed, such as a cup of coffee. Other goods end up at the landfill. True, some goods can be recycled, and it would be nice to see this on the diagram. The only flow which is truly circular is the flow of money.
Third, the simple diagram does not explain economic growth. The system is stable, and the level of production is constant. Some economists – especially Austrians – believe the model is thus fundamentally flawed because it does not explain how the economy starts producing and grows. This is a basic tautology, a major flaw in logic.
Also, the model does not:
- account for growth
- explain how firms and households set prices
- account for risk of production methods
- account for risk of choosing what to produce
- account for opportunity costs
“The most important actor in the economic process for Austrians, and an element crucial to every single real-world market—the entrepreneur—is missing from the circular flow didactic. It is the entrepreneur who judges future expected consumer good prices, anticipates future market conditions, seeks new production techniques, and delivers the product to the consumer. Without a role for the entrepreneur, the circular-flow diagram loses all touch with reality.” (Simpson & Kjar, 2005)
-
What is Macroeconomics?
The Circular Flow Diagram is a basic model of macroeconomics, which is a branch of economics that deals with economies as a whole. It usually measures the behaviour of aggregate statistics, which means the sum of all spending, for example.
Macroeconomic research started after John Maynard Keynes wrote a very important book in 1934, called The General Theory of Employment, Interest and Money. In it, he argued the government must become an active force in the economy. Keynes lived during the Great Depression which started in 1929 in the USA and quickly spread to Europe. The downturn was the result of shady investment practices at the New York Stock Exchange. But the result was a massive shift in consumer spending because of unemployment, and loss of confidence.
Keynes’ theory explained that saving more money can be good for individuals, but if the shift is too swift, the decrease in consumption will hurt the economy. Classical economists disagreed. According to Say’s Law, savings would be re-injected in the flow by banks, as investments. Also, they argued wages should decrease to help producers hire more workers.
Keynes argued that banks were too scared to help. They were sitting on the cash and were not investing money in the economy. Also, Keynes argued that workers hate wage reductions because they don’t trust their bosses, or economic theory. Keynes therefore argued for state intervention because things just kept getting worse.
Before Keynes, governments were generally small and taxed relatively sparsely. Keynes argued that economists should include government spending into the equation of consumer spending and investment. If these latter kinds of spending are in a slump, the government could and should take over to give the economy a boost. We can use the simple circular flow diagram to show the impact of a decrease in consumption spending on the market for labour.
Green Policy
The circular flow model gets one thing wrong. The flow of material culture (resources and production) in the model is not circular at all. The only part of the model to be truly circular is the monetary aspect.
The main problem with our economy is not that money is leaking from the closed-circuit system. The main problem is that we are over-extracting resources from the earth, and we are over-producing BADS which damage the natural environment.
There are many well-known approaches to alleviating this issue.
The following list is from the Ellen MacArthur Foundation, a leading charity devoted to researching Circular Economics and developing sustainable production flows with industry.
One approach is called Cradle to Cradle. It was developed by German chemist Michael Braungart and American architect Bill McDonough. Its aim is to eliminate waste, power with renewable energies, and respect natural systems. Another approach is called the Performance Economy, lead by Swiss Architect Walter Stahel. Its aim is to extend product-life, design long-life goods, improve reconditioning activities, and prevent waste. To achieve these goals, one technical approach is Biomimicry, as presented by American scientist Janine Benyus. To reduce waste and energy, one can study nature, where very efficient processes are at play. Another practical approach to helping achieve a circular system is called Industrial Ecology. This is a scientific discipline whose goal is to design closed-loop production systems.
A circular economy would have very low Life-Cycle Costs of production. Input costs and End-Use Disposal costs are reduced drastically. Hopefully a more efficient system would not only help save the natural environment, but also reduce market prices.
Democracy Booster
It is important for households to know that without them, there cannot be production. The model is quite clear about this. Take out the households, and who buys production?
For quite some time, the model was used to argue in favour of democratic labour unions to help improve the wages of regular workers in the economy. This is a political battle, because since the monetary system is a closed circuit, the money has to be taken from other income streams, such as rent, profits and interest.
Wrap-Up
The Circular Flow Diagram explains who does what, and predicts the economy is vulnerable to shifts in spending.
Keynes invented macroeconomics in 1934 because of deep shifts in spending that turned the 1929 recession into the Great Depression. He was looking at the forest rather than the trees.
Cheat Sheet
Circular Flow:
this theory explains how someone’s spending becomes someone else’s income.
Macroeconomics:
the study of the economic behaviour of groups of people, rather than individuals.
References and Further Reading
Ellen MacArthur Foundation. (2020). Circular Economy Schools of Thought. https://www.ellenmacarthurfoundation.org
Keynes, J. M. (1934). The General Theory of Employment, Prices and Money.
Simpson, B. D., & Kjar, S. A. (2005) Circular Flow, Austrian Price Theory, and Social Appraisement. The Quarterly Journal of Austrian Economics. 8(4).
Stahel, W. (2010). The Performance Economy, 2e. Palgrave Macmillan.