
The Government Budget
Why Should I Care?
Politicians are taxing you, and spending your money. You might be interested to know how much, and where the money goes.
This Lecture Has 6 Parts
- The Flow of Tax Money in Canada
- The Balanced Budget
- Federal Tax Revenue
- Federal Government Expenditures
- Equalization
- The Government Deficit and Debt
What is the Government Budget?
Governments are a big player in our economy, as they impose taxes and spend billions of dollars to produce public services.
Governments need to keep an eye on their budget so that they don’t contract too much debt. The Government of Canada has a budget, a plan of the year’s expenditures and revenues. The budget is drafted by the Department of Finance, who is in charge of contracting debt if necessary. The budget must pass a vote at the House of Commons, in Parliament (James, 2011: 295).
The budget specifies expected spending, such as the military, embassies, justice system, health care, education, and other public services. The budget also determines the required level of taxation needed to raise sufficient funds to pay for all these services. Each government slates a budget in the spring, which establishes estimates of revenues it expects to receive in the next year. The government also establishes “credits” for each of its departments.
These credits tell civil servants how much they can spend in the year. At the end of the year, the government compares the actual revenues, with the actual spending. There may have been changes made during the year, or expectations may have been wrong.
Keep in mind that governments are under the Budget Constraint. This is to say that expenditures can be paid for, when revenues are insufficient, in only three ways:
- Increase Government Debt
- Increase Taxes
- Increase Money Supply (Inflation)
During war times especially, governments tend to finance their budget deficits with an increase in money supply (fiat currency). This is what Keynes meant when he said that “Inflation is a Tax in Disguise”. The government gets its funds to continue the war, but consumers will end up paying in the long run when prices increase.
-
The Flow of Tax Money in Canada
Tax money in Canada is collected by many levels of government, but there is a redistribution mechanism that flows much of the money from the top, down the chain of commands. This is important to understand if you wish to understand where your tax money goes.
1 – THE FEDERAL GOVERNMENT
Most tax money is collected by the federal government, also called “Ottawa”. There are four main directions the money will take afterwards. We will show the exact figures later in this section.
First, Ottawa spends part of its money on its own needs, such as defence, justice, foreign affairs, and other federal jurisdictions, granted to it by the Constitution Act of 1982, following that of 1867. This also includes interest payments on past debt.
Second, Ottawa writes cheques to individuals, such as the Old Age Pension, child support, and transfers to disabled persons. Ottawa also provides half the money for Welfare payments, which are managed by the provinces.
Third, Ottawa writes cheques to the provinces and territories. These are called transfer payments, and cover infrastructure, health, justice, and education expenditures. They can be ear-marked for specific policy objectives, or not. There is an extra transfer for poor provinces called Equalization.
Fourth, Ottawa operates a parallel governance regime for Indigenous Persons, which is organized under the groups of Métis, Inuit, and First Nations. Métis are generally considered to be covered under provincial regimes. Inuit are mostly living in the territory of Nunavut, or in the Provincial North of Quebec, and Labrador. The Inuit thus receive funds through the Ministry of Northern Affairs, or through the provinces. First Nations (legally called “Status Indians”) are entitled to services on reserves, which are delivered by the federal Ministry of Indigenous Affairs. This includes schools, housing, medical clinics, and general infrastructure such as roads, electricity and running water.
Generally speaking, provinces do not provide services to First Nations on reserve. The local band-council runs mostly on federal funds, but many have added self-generated income from business activities. Indigenous Persons living off reserve receive services from the province and their municipality.
2 – THE PROVINCES
Canadians also pay taxes, and a sizeable chunk, to their home province. Together with the federal transfers, this allows the province to cover its expenditures for the services they are allowed to provide, according to the Constitution. This includes transportation, education, health care, and its share of justice.
In Canada, dangerous criminals (2 years + sentence) are under federal care in penitentiaries. Less dangerous criminals (2 years minus 1 day) are under provincial care in prisons. Provinces also oversee lotteries, liquor stores, automobile license plates and insurance, energy supply, mining claims, forestry and logging rights, and the oversight of municipalities.
In terms of transfers, provinces write cheques to individuals, for example in the form welfare payments, but also to municipalities, who need money to build important infrastructure such as water treatment plants, transit systems, and the road network.
3 – THE MUNICIPALITIES
If they own a home, most Canadians pay municipal taxes to their local village, or city. Cities can also charge tariffs such as parking fares, so they are thus able to pay for snow removal, hockey rinks, libraries, parks, and community centers. However, without the transfers from their province, the city would not have enough money to run its yearly operations. For large projects such as building a water plant, or digging out a metro tunnel, municipalities need to ask money from both their province, and Ottawa.
4 – THE TERRITORIES
Very few Canadians live in a “territory”, such as Yukon, North West Territories, or Nunavut. These territories used to cover most of Canada’s land mass. Most of the territories were transferred to provinces towards the end of the 19th century. They had been converted into territories from their previous status of “Indian Land” or “Rupert’s Land” under the Royal Proclamation of 1763.
Since the 1982 Constitution, and subsequent agreements, including many land claims with namely the Inuit, the Gwich’in and the Tlicho nations, the territories have become much more autonomous. Where they used to be subject to direct management by Ottawa’s ministry of Northern Affairs, and a federally appointed Governor, they now can collect taxes and royalties, control land and resources, run municipalities, and resolve many local issues in their legislative assemblies. Ottawa still controls health and education.
5 – THE BAND COUNCILS
Under Canada’s Constitution, First Nations living on reserves are managed by local Band Councils, which are mostly funded by federal funds. Many bands are active in earning business income, such as fisheries, mining agreements, tourism and casinos, and are less dependent on the federal purse. About a quarter of bands also collect taxes on reserve. Band councils are nonetheless directly managed by the federal government’s ministry of Indigenous Affairs (previously Aboriginal Affairs, or Indian Affairs).
Band councils usually manage about five to ten times more money per capita than Canadian municipalities. However, this money serves to provide a lot more services, which are not offered to them by the province. Band councils must provide education, health care, and justice, as well as local services such as snow removal, public libraries, infrastructure, and running water. Under this system, they usually get less services than Indians off-reserve who become tax-paying citizens and recipients of province-supplied services.
Let’s not forget that reserves are usually small plots of land where “Indians” were rounded up as refugees on their own land. Almost all of the territory was turned to provinces which by design where devoted to providing farm land, forestry and mineral resources to settlers loyal to the British Crown. About two thirds of all Canadian land was ceded by natives in the numbered treaties, so that the Western provinces could be created, and Ontario expanded.
-
The Balanced Budget
We can say the government has a balanced budget when the government’s expenditures are equal to tax revenues.
G = T : Balanced budget
When the government’s expenditures are inferior to tax revenues, the budget is in surplus. The government will have extra funds to set aside for the future, or to pay down its debt.
G < T : Budget surplus
When the government’s expenditures are superior to tax revenues, the budget is in deficit. The government will have to withdraw from its savings accounts, or contract debt, to pay for the over-spending.
G > T : Budget deficit
The federal government has been running a budget deficit for the past few years. For the fiscal year 2021-2022, Ottawa’s revenues were 316.4 billion dollars. Unfortunately, the government spent a whopping 628.9 billion dollars. The result was a 327.7 billion dollar budget deficit, worth more than a full year of revenue. This is a record, and obviously due to massive government intervention in the wake of the COVID-19 pandemic.
https://budget.gc.ca/2022/pdf/budget-2022-en.pdf
Because of a growing population, but also an aging population, government is pressed to increase spending every year. Since the Great Recession of 2009, the budget deficits have constantly hovered around 20 billion per year. Prime Minister Justin Trudeau’s liberal government predicted running double-digit deficits until 2022. No one predicted a 300 billion dollar deficit. Ever.
Where did the money come from? Not the federal government's savings account. It was done on credit. More on this later.
Table - Examples of budget positions (billions $)
|
Tax revenue |
Government expenditure |
Budgetary Balance |
Budgetary Position |
|
450,000 |
455,000 |
-5,000 |
Deficit |
|
375,000 |
365,000 |
10,000 |
Surplus |
|
398,000 |
398,000 |
0 |
Balanced |
|
401,000 |
429,000 |
-28,000 |
Deficit |
-
Federal Tax Revenue
There are three levels of government in Canada, and they all levy taxes (reserves and band councils can also levy taxes and 1/4 of them do).
The federal government raised 316,4 billion dollars in 2020-2021. Most of that money comes from income tax (55.2 percent), while corporate taxes only make up 17.1 percent of total revenue. Other taxes include the famous Goods and Services Tax (GST), a 5 percent charge on retail consumption. It only represents 10.2 percent of all revenue.
Also note that taxes on imports (duties) are quite low and were not expected to rise at the time of drafting this budget (February 2022). However, the US Trump administration has been increasing its duties on Canadian goods, such as steel and aluminum. The Trudeau government has answered with increases on other US goods imported to Canada. Duties may well be increasing in the next years.
Table - Federal Government Revenues, 2020-21
| Revenue streams | 2020-21 | Share of total |
| Total income tax | 237.0 | 74.9% |
| Personal income tax | 174.8 | 55.2% |
| Corporate income tax | 54.1 | 17.1% |
| Non-resident income tax | 8.1 | 2.6% |
| Total excise taxes/duties | 47.0 | 14.9% |
| Goods and Services Tax | 32.4 | 10.2% |
| Customs import duties | 4.3 | 1.4% |
| Other excise taxes/duties | 10.3 | 3.3% |
| Pollution Pricing Framework | 4.4 | 1.4% |
| Employment Insurance premium revenues | 22.4 | 7.1% |
| Total other revenues | 5.7 | 1.8% |
| Crown corporations | -10.5 | 3.3% |
| Other programs | 14.1 | 4.5% |
| Net foreign exchange | 2.2 | 0.7% |
| Total budgetary revenues | 316.4 | 100.0% |
Source: Federal Budget 2022. https://budget.gc.ca/2022/pdf/budget-2022-en.pdf
Note that the figures in 2020-21 did show some variation across a few categories, namely Crown Corporations who say their revenuerevenues dropdropped during the pandemic. However, the revenue picture was roughly the same as in previous years so we won't bore you with a time-series here. The story with expenditures, however, is completely different.
-
Federal Government Expenditures
The federal government spent a record-breaking 628.9 billion dollars in 2020-21. This is double the usual amount (111.9 percent increase from 2016).
The reason was obviously the COVID-19 pandemic for which Ottawa created new programs. A new personal transfer called the COVID-19 Income Support for workers cost 55.5 B$. A new corporate transfer called the Canada Emergency Wage Subsidy cost 80.2 B$. Regular programs were also more expensive due to the pandemic. For example, Employment Insurance almost tripled, costing 58.4 B$. A provincial transfer category (Other transfer payments) more than doubled to 98 B$, allowing Ottawa to help provinces pay for pandemic-response programs. These four accounting categories amount to 292 B$, which explains the budget deficit.
Adding to this situation, many of the regular components of the budget were also increasing. Elderly Benefits were up 21.4 percent. Children's Benefits were up 24 percent. Major transfers to provinces were up 55.3 percent.
The only budget expense coming down was - ironically - debt charges, which at 20.4 B$, were lower than in 2016, mostly because of the lower interest rates prevailing in Canada.
Table - Federal Government Expenditures, 2020-21
| Expenditure Accounts | 2020-21 | Share | Variation since 2016 |
| Major transfers to persons | 200.1 | 31.8% | 120.1% |
| Elderly benefits | 58.5 | 9.3% | 21.4% |
| Employment Insurance | 58.4 | 9.3% | 182.1% |
| COVID-19 Income Support for workers | 55.5 | 8.8% | n.a. |
| Children’s benefits | 27.4 | 4.4% | 24.0% |
| Major transfers to other levels of government | 106.7 | 17.0% | 55.3% |
| Canada Health Transfer | 45.9 | 7.3% | 27.1% |
| Canada Social Transfer | 15.0 | 2.4% | 12.8% |
| Equalization | 20.6 | 3.3% | 15.1% |
| Territorial Formula Financing | 4.2 | 0.7% | 16.7% |
| Canada Community-Building Fund | 4.3 | 0.7% | n.a. |
| Home care and mental health | 1.3 | 0.2% | n.a. |
| Canada-wide early learning and child-care | 0.0 | 0.0% | n.a. |
| Other fiscal arrangements | 15.4 | 2.4% | n.a. |
| Proceeds from pollution pricing framework returned | 4.6 | 0.7% | 119.0% |
| Direct program expenses | 297.2 | 47.3% | 132.9% |
| Canada Emergency Wage Subsidy | 80.2 | 12.8% | n.a. |
| Other Transfer payments | 98.0 | 15.6% | 135.6% |
| Operating expenses | 119.1 | 18.9% | 38.5% |
| Total program expenses | 608.5 | 96.8% | 111.9% |
Source: Federal Budget 2022, https://budget.gc.ca/2022/pdf/budget-2022-en.pdf
When the pandemic programs subside, we can expect that Ottawa will tend to be able to balance its budget. In this case, about one-third of the money is spent on running and operating the functions of the federal government such as the military, justice, environment, and foreign affairs (including welfare cheques, Ottawa’s share is half of the program, provinces pay the rest).
A third of the money is directly transferred to people, such as elderly, children’s parents, or unemployed. An extra set of transfers are sent to provinces, but made through several departments in Ottawa. These transfers are included in the operating expenses.
A fifth of the budget is directly transferred to provinces. This allows them to help pay for hospitals, schools, roads and welfare.
Interest payments on federal debt represent one-tenth of the budget.
More than two-thirds of the money collected by Ottawa is used to cut cheques to people, the provinces, or lenders. Only about one-third is used for the constitutional functions of the federal government.
-
Equalization
As Canada is a federation, most of the public services are supplied by the provinces, which hold some level of autonomy. This “sharing of powers” is protected in Canada’s Constitution. However, Canada’s first constitution (1867) gave Ottawa the sole role of collecting taxes. Quebec was the first province in Canada to implement its own income tax regime, under the Maurice Duplessis Union Nationale government. Other provinces have followed suit since, but Ottawa still collects most of the taxes in the country.
To be able to provide the services which are under its responsibility, the Quebec government receives transfers from Ottawa, as well as collecting its own revenues. To ensure that services across the country are of equal quality, the federal government runs an equalization program which takes 20.6 B$ from total Canadian tax base. The money from this program is transferred to the poorer provinces which are PEI, Nova Scotia, New Brunswick, Manitoba, and Quebec. There is also a scheme for the Territories called Territorial Formula Financing.
Quebec gets the largest cheque (13.2 B$ in 2021), which counts for more than half of the money in the program. But when you factor in the size of the population, Quebec gets about half of the PEI and New Brunswick transfers. This is because Quebec is poor enough to get an equalization cheque, but not as poor as the Maritime provinces. Equalization is a contentious issue in Canada/Quebec politics. Federalists argue that Quebec would have a hard time managing without the transfer. Sovereigntists argue the program is an unproductive largesse which is keeping Quebec in a state of dependency towards the rest of Canada. Resentment has also grown in recent years in the western provinces, namely Alberta, whose taxpayers don't benefit from the program. It should be noted that Alberta's GDP per capita is twice that of Quebec.
Table - Equalization Transfers per Province and per capita, 2021
| Province | 2021 Transfer (M$) | Population 2021 | per capita |
| PEI | 454 | 154 331 | 2 942 $ |
| New Brunswick | 2 210 | 775 610 | 2 849 $ |
| Nova Scotia | 2 146 | 969 383 | 2 214 $ |
| Manitoba | 2 510 | 1 342 153 | 1 870 $ |
| Quebec | 13 253 | 8 501 833 | 1 559 $ |
| Total / Average | 20 573 | 11 743 310 | 1 752 $ |
Source: Finance Canada 2021, Census 2021, Author's calculations.
There has been some movement on the list of provinces that benefit from the Equalization programme. Many years ago, Newfoundland was in the same economic position as its neighbours in the Maritimes. In fact, it was bankrupt when it joined Canada in 1949. However, finding oil on what's now known as the Hibernia platform in the Atlantic Ocean, has pushed the historically poor province out of Equalization and into the list of rich provinces.
Ontario has long been a wealthy province in Canada, thanks to the finance industry being clustered on Bay Street in Toronto, and the automobile industry sprinkled between Oshawa and Windsor. The 2008 recession changed the status of the province from 'have', to 'have-not', putting it on the list of beneficiaries of Equalization. Things have gotten back on track for the province and it is now back to 'wealthy province' status.
Finally, a word about Alberta, whose oil-wealth seemed to be unending and unlimited. This has slowed down recently as Alberta struggles to transition its economy out of oil and into clean technologies. There is talk the province might eventually receive Equalization but only time will tell.
-
Government Deficit and Debt
Government’s go into debt when their budget is in deficit. Repeated deficits will grow the debt. Government debt is equal to the accumulated deficits. Governments usually prefer to run a surplus before they start paying down debt. Every year though, they must pay the interest charges.
In 2021, the federal debt clocked in at 1,004,360,000,000 $ or 1 trillion dollars. That number has doubled in about a decade. Ottawa's debt is now worth 50.5 percent of the country's GDP.
The following graph shows the actual situation in Canada, since 1966 (PBO, 2021). Notice that there was 15 year period from 1980 to 1995 where moderate budget deficits (blue line) were consistently recorded and contributed to an important increase in the accumulation of debt (orange line). These were mostly under the auspice of the Brian Mulroney progressive-conservatives. As of 1995, Ottawa was being pressured by international creditors to bring order to its fiscal house. The Jean Chrétien liberals proceeded to reduce deficits until they (later the Paul Martin liberals) were able to run surpluses in the years 1997 to 2008. You can see on the graph that during this time, the debt level actually decreased, allowing Canada to regain its credibility on international credit markets.
In 2008, the Great Recession forced the conservative Stephen Harper government to increase spending in what was then an unprecedented stimulus package of more than 60 billion dollars. Things were getting slightly better in the years 2014 to 2019, as the liberal Justin Trudeau government was planning on reducing deficits rather slowly, keeping them in the 20 billion dollar range. Of course the 2020-2021 COVID-19 pandemic changed those plans. You can see that the never-seen-before deficit of 2020 had a direct impact on the debt level.
Graph - Federal Budget Balance and Debt
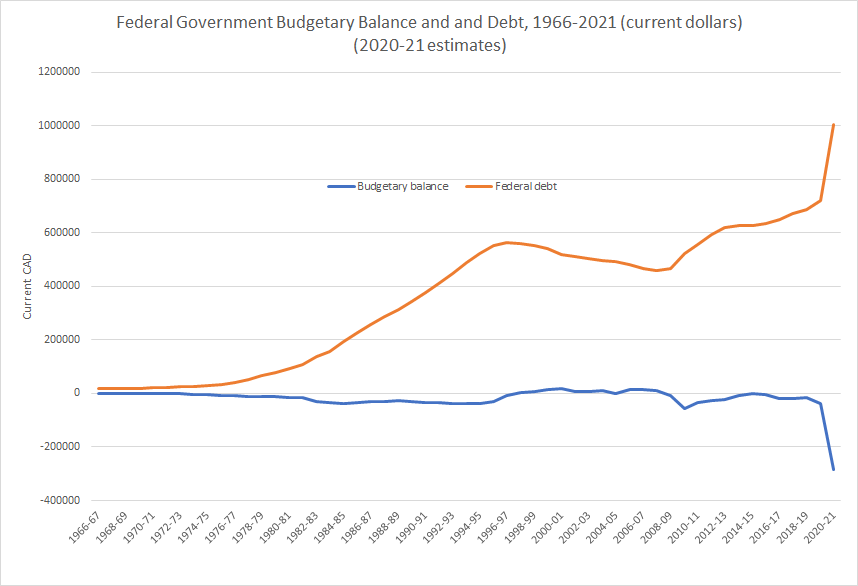
Source: PBO, 2021. Personal communication.
Deficits are meant to help the economy get back to potential output. In the case of Quebec, the government balanced its budget in 2018-2019, but resorted to massive spending during the pandemic as well.
Comparing countries
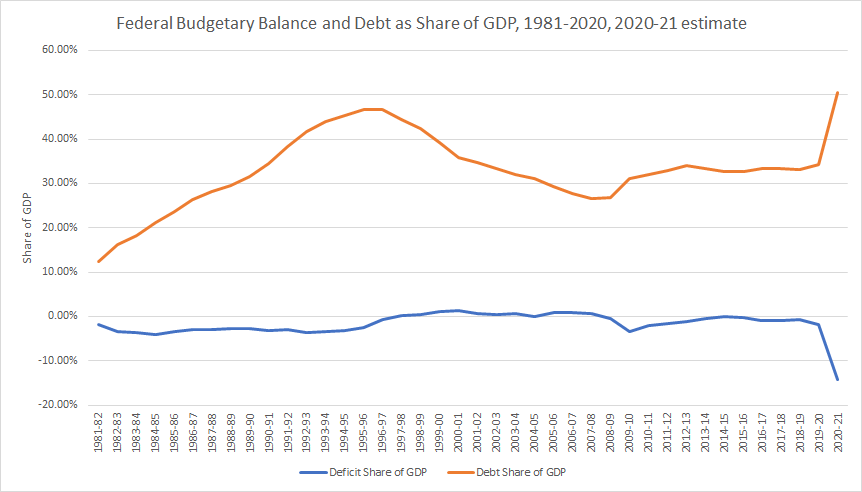
To compare budget deficits across countries, or over time, economists use a share of the budgetary balance over the countries’ GDP figure. A one percent budget deficit, as a share of GDP, is a lesser problem than a 15 percent deficit/GDP. Canada's debt might sound astronomical, but considering the size of our economy, it might be much more manageable than in another country. By looking at Debt as Share of GDP, one can see that Canada had the 'credit room' to enact so much debt.
The last time our federal debt was an issue, was back in 1995. The International Monetary Fund was breathing down our necks asking for repayment on debt issued in the name of the government through the 1980's and 1990's. In 1995, the Debt to GDP ratio was 46.6 percent (orange line). Ottawa proceeded to reduce its spending, and cut the deficits. As you saw before, that did not really reduce the overall debt by much, but since the economy was growing - and there was quite a bit of growth in the 2000's - the Debt to GDP ratio dropped to 26.9 percent in 2008. Of course the subsequent deficits brought that ratio closer to 30 percent, but this is a manageable level. As you can see on the graph below, the record-breaking 300 B$ stimulus package of 2020-21, increased the Dept to GDP ratio to 50.5 percent, which is only slightly higher than in 1995.
If you look at the Budget Position as a Share of GDP (blue line), you can see that the huge stimulus of 2020-21, was actually worth 14.2 percent of GDP. This is still a record, but it helps to put the nominal values in perspective. Notice the relative size of the 2009 deficit (3.3 percent), it seems to be about the same in weight as those repeated deficits of the 1980's and 1990's (ranging from 2.4 to 4.1 percent).
Graph - Federal Budget and Debt as Share of GDP
As you can see in the table below, Canada's debt is not as critical as those of Japan, Sudan, Greece, Eritrea, and Cape Verde, whose Debt ratios are more than double their GDP. Greece, Sudan and Japan are more than triple.
Table - Top 5 Countries with most debt to GDP, 2021.
| Rank | Country | Debt-to-GDP |
|---|---|---|
| #1 | Japan  |
257% |
| #2 | Sudan  |
210% |
| #3 | Greece  |
207% |
| #4 | Eritrea  |
175% |
| #5 | Cape Verde  |
161% |
Source: IMF World Economic Outlook, cited from https://www.visualcapitalist.com/global-debt-to-gdp-ratio/,
Wrap-Up
The Government Budget has an impact on the economy. When the budget is in deficit, tax revenues are insufficient to cover expenditures. A budget surplus means tax revenues are superior to expenditures.
The Canadian government runs an equalization program which takes money from the rich provinces and gives it to the poor. Quebec gets more than half of this: 13 billion dollars.
Cheat Sheet
Balanced budget:
When government expenditures are equal to tax revenues.
Budget surplus:
When government expenditures are inferior to tax revenues.
Budget deficit:
When government expenditures are superior to tax revenues.
Government debt:
Accumulated deficits.
Equalization:
Redistribution program to poor provinces.
References and Further Reading
Colander, D. C., Rockerbie, D. W., & Richter, C. (2006). Macroeconomics, Third Canadian Edition. McGraw-Hill Ryerson.
Government of Canada. (2022). Budget 2022. Department of Finance. Retrieved June 10, 2022, from: https://budget.gc.ca/2022/pdf/budget-2022-en.pdf
MacMahon, T. (2011). WTF: The federal budget and 50 years of Canadian debt. The National Post. Retrieved from http://news.nationalpost.com/2011/03/21/graphic-50-years-of-canadian-debt/
Sabin, J. (2017). A Federation within a Federation? Devolution and Indigenous Government in the Northwest Territories. IRPP Study. N. 66, November 2017. Retrieved March 22, 2018, from: http://irpp.org/wp-content/uploads/2017/11/study-no66.pdf
Visual Capitalist. (2021). Global Debt to GDP Ratio. Retrieved June 10, 2022, from: https://www.visualcapitalist.com/global-debt-to-gdp-ratio/