
Spreadsheets
Why Should I Care?
Being able to make a table, or a graph, is really useful. You can use this skill for personal reasons, like planning a wedding, or your personal budget. You can also use it to write better papers for school.
This lesson has 3 parts
- Cells and Tables
- Making Graphs
- Copy to Word
What are Spreadsheets?
The second most important software on your computer, after the word processor, is probably the spreadsheet. The most commonly used software for this is called Microsoft Excel, but there are others available such as Google Sheets, Apple Numbers and Apache OpenOffice. This lesson is based on Excel, the industry standard.
Excel Basics Tutorial
-
Cells
The cell is the basic tool of the spreadsheet. You can write text or numbers in any cell. You can change their size, and colour. You can add cells and you can also write complex equations in a cell, relative to other cells.
There is also a large box at the top of the program, for you to write directly in the cell selected. This is the Formula Bar. It's really useful.
Notice the cells are identified by columns (letters) and rows (numbers). Cell D5 is in column D, and row 5. This is really important if you want to write up equations later on.
You can make a whole column wider by selecting its border, in the top heading with the letters, and dragging it out. You can do the same with rows.
Numbers in the cell can be formatting quickly. Simply right-click on the cell with your mouse, and select Format Cell. You can then choose formats for money, accounting, percentages, or other units of measurement.
Keyboard Shortcuts
Most of the keyboard shortcuts in Excel are the same as in Word. You can cut, copy and paste the content inside a cell, or the cell itself. You can also format fonts, size, bold, etc. See the lesson called Word Processors for all the shortcuts.
To make a table, simply write the category titles in a column. Then input numbered values in the next column. Identify the variables with a label in the cell at the top of each column.
-
Making Graphs
Once you have a table, you can make graphs really quickly.
Steps
- Select the whole table, including the variable labels. Click and drag mouse to select. Or use Shift-Arrow.
- Go to Insert, in the top panel
- In the Graphs section, select the type of graph you prefer.
Voilà.
Now you can format the graph. We recommend that you use one of the Quick Format templates, especially n.9, because it includes the label boxes for each axis.
- There are 2 new tabs for graphs in the top panel, to the right.
- Go to Create Graph, click on Quick Format
-
Select Template n. 9
-
Copy to Word
Once you are done with your table, or graph, you can easily copy it to Word document. First, we recommend you save your Excel file separately on your computer.
Steps
- Select the table, or graph, and type Ctrl-C.
- Open your Word file.
- Place the cursor in the location you want the table/graph.
- Type Ctrl-V.
- You may be prompted to select how you wish to paste the object
- Select the first icon 'destination theme' to paste the image, and the data, which you can alter later in Word. Recommended.
- Select the last icon 'image' to paste only the image, and not the data. Recommended for simplicity.f
- Select the second (or third) icon 'link the data' to paste the image, the data, and an automatic adjustment link between Excel and Word. Not recommended.
- Select the first icon 'destination theme' to paste the image, and the data, which you can alter later in Word. Recommended.
-
Simple Equations
Excel is like a calculator on steroids. You can write formulas and equations in any cell. Notice that there is also a large box at the top of the program, for you to write directly in the cell selected.
Steps
- Click on a cell, or press F2. The cursor will be active in the cell, you can now write inside of it.
- To start an equation, or a formula, type the equal sign =.
- Select another cell that is part of the equation
- Add a mathematical operation, such as + - , or * and /.
- Use parentheses if there are many parts.
- Select another cell, until complete.
- Type enter
Example
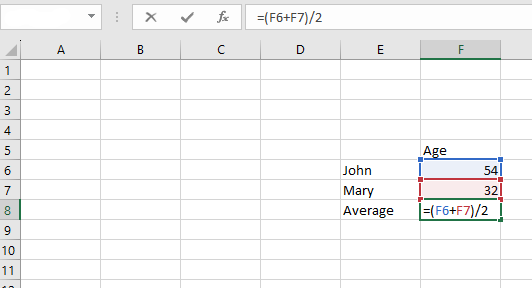
A simple table with two persons, and their age. John is 54, and Mary is 32 years old. You wish to calculate the average age.
- Select the cell F8 below Mary's age.
- Double click.
- Type =(F6+F7)/2.
- You can also use the mouse, or the arrow keys to select the cells F6 and F7.
- Type enter.
The answer 43 will appear in cell F8, but the formula will remain to be seen in the formula bar.
Automatic formulas
The following prompts can be written in the formula bar. You must add a selection of data for the calculation to be operated. For example, =AVERAGE(F6:F7) would calculate the average for data in the selection from F6 to F7.
=SUM
=AVERAGE
=MODE
=MEDIAN
References and Further Reading
Harvey, G. (1994). Excel for dummies. Wiley.
No Comments