
8 – Available Data
Why Should I Care?
Many – if not most – researchers are producing reports based on data that was collected by someone else. This is convenient because it saves time and money. But it is also tricky because there may be gaps or errors in the data that the end-use researcher is not aware of. If you
Usefulness
The point of this is to use data that already exists. Using Available Data is especially easy if you download a data set from a website on the internet. Government statistical agencies, such as Statistics Canada, are obvious go-to sources of Available Data. However there are many, many more sources, such as government websites, corporate filings, and even police reports.
This method is especially useful because you can use many data sets together. If the data sets have a common variable, you can merge them together into one database. We recommend learning a database language if you wish to use large data sets, such as SQL, R, or Python. Smaller data sets will run on regular spreadsheet software such as MS Excel.
What's Python?
You don't need to learn Python, but it's a really popular skill in the field of Data Analysts.
Much of the Available Data on the internet or in libraries is collected for a pre-determined purpose, but researchers can use them for other purposes, and also merge data sets together, so that they can analyze all sorts of information in ways that were not necessarily meant to be.
Available data is often times quantitative in nature, but can also include many qualitative elements. For example, a yearly annual report published by an organization may be a good source of available qualitative data. It might even include facts or opinions that individuals would not feel comfortable to share in an interview. In the world of business, much of this qualitative data is available in legal filings that publically-owned corporations must divulge. This includes risk assessments and management strategy which are wholly qualitative in nature.
Merging Three Data Sets Into One
For example, if you have the telephone listings such as a business phone book, or a directory, you usually have many bits of information such as company name, address, telephone number and postal code.
Using a geographical information system (GIS) database, you can associate postal codes to a geography, such as longitudes and latitudes.
Using a third database with company information, including sales, profits, and number of employees, you now have a complete data set with company data that you can map using computers.
To merge the data sets, you will need strong software, such as R, Python, MS Access, or SPSS. MS Excel can work, but only if the number of lines of data is less than 1 million.
In this example, start by merging with the phone book and the GIS, using Postal Codes as a common variable.
Then you can merge the financial information to the rest, using Company Name as the common variable.
You will have to explain this in the methodology section of your paper, citing all three data sets.
Objects of Measurement
|
Type of Object |
Yes |
No |
Maybe |
Data Source |
|
Personal Characteristic |
X |
|
|
StatsCan Age Figures |
|
Socio-Demographic Characteristic |
X |
|
|
StatsCan Language Figures |
|
Opinion |
X |
|
Political Polls in Media |
|
|
Motivations |
|
X |
|
Do an Interview |
|
Ideology |
|
|
X |
Do an Interview |
|
Biases / Prejudice |
|
X |
Frequency of Hate Crimes, Police Records |
|
|
Preferences |
|
X |
|
See results of prior Natural experiment |
|
Personal History / Background |
|
X |
|
Do an Interview, Unobstrusive Measrmt |
|
Family Dynamics |
|
X |
|
Do an Interview |
|
Cultural History |
|
|
X |
Do an Interview |
|
Perception / Self-Perception |
|
|
X |
Do an Interview |
|
Aptitude /Ability |
|
X |
|
School math tests / World rankings |
|
Behaviour |
X |
|
|
Stats Can Sales Figures / Census |
|
Level of Knowledge |
X |
|
|
School tests |
Sources of Available Data
Here are some sources of available data. You can ask any public or private organization for documents or data sets. Of course they may deny or refuse to share. Think of the local police service, the local hospital, or school board. Every one of these institutions must publish annual reports, which are usually shared with media and scholars. Look for them on their websites. Some data sets are publicly available and free, as you can see in the table below.
However, some of these data sets are not free. 'Available' means it's ready to be analyzed. For example, one of the most used data sources is the Bloomberg terminal service, which might cost a few thousands of dollars per month. This is a subscription service for professionals in the fields of finance and business. These special computers give you access to thousands of data sets which are ready to be viewed, and broadcast.
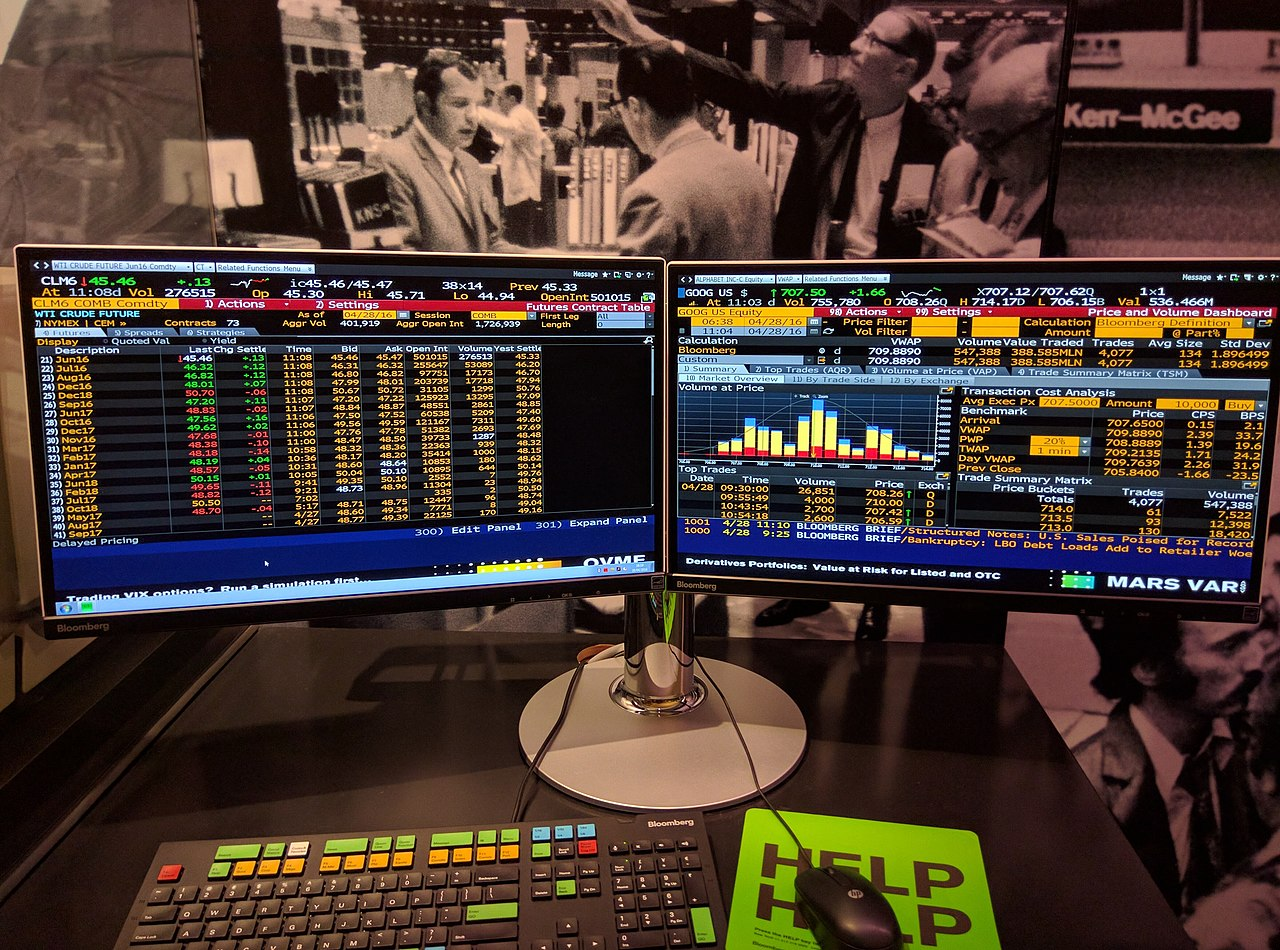
Photo credit: Bloomberg Terminal. https://en.wikipedia.org/wiki/Bloomberg_Terminal#/media/File:Bloomberg_Terminal_Museum.jpg
| Corporate Data |
||
| Financial Reports |
Sedar |
https://www.sedar.com/ |
| Stock Prices |
Toronto Stock Exchange |
https://www.tmxinfoservices.com/tmx-datalinx/products-and-services/real-time-data |
| Statistical Agencies |
||
| Statistics Canada |
Census Program |
https://www12.statcan.gc.ca/census-recensement/index-eng.cfm?DGUID=2021A000011124 |
| Labour Force Survey |
https://www150.statcan.gc.ca/n1/daily-quotidien/230406/dq230406a-eng.htm |
|
| Public Registers |
||
| Firearms Registry |
RCMP |
https://www.rcmp-grc.gc.ca/en/firearms/police-public-agency-web-services |
| Real Estate Ownership |
City of Montreal |
https://servicesenligne2.ville.montreal.qc.ca/sel/evalweb/index |
Sampling
Since data collection is already done, the researcher must live with the sampling technique, and its flaws, that the previous researcher/organization has chosen and used.
Operationalization of variables can be a challenge. Some phenomena are hard to measure, but can be observed indirectly. One should be careful in the interpretation.
For example, if you wish to measure innovation, your only source of data is a patents data sets. This is an issue because lots of innovations are kept secret, but we don’t know how many of them are secret, since the company behind the innovation wants this to be confidential.
Instruments
No instrument. Data is previously collected. Usually survey.
Even if the user of available data was not the one to design the data collection instruments, he or she is vulnerable to criticism about the methodology. In essence, you are adopting someone else's design and operationalization choices. It is your responsibility to read the methodology statements of the data source, and to be conscious of any problems.
Scientific Power
Exploratory:
Possibly. If you don’t know what you are looking for, you can draw graphs look for stories. This practice is called 'Data Mining', and is becoming more popular with large data sets and AI driven tools.
Descriptive:
Most likely. You will associate variables, using tables and graphs.
Explanatory:
Possible. Be warned to tread lightly. The variables that don’t correlate can be eliminated. Those that do correlate will be kept. However, be sure to establish temporal order of each variable, so that you can determine a cause-effect relationship.
Steps
- Find data source
- Download
- Analyze, Interpret and Report
Advantages
- Fast
This method allows you to start analyzing data very quickly. - Lots of quantitative
The proliferation of computers allow you to download quantitative data sets from the internet, or to have them delivered on a data storage disk. - Allows more time for analysis of data
Since you don't have to collect the data, you have more time to sift through the data and organize it in categories, draw graphs, and calculate statistics.
Disadvantages
- Methodology faults may be hidden
You are adopting someone else's design and operationalization choices. It is your responsibility to read the methodology statements of the data source, and to be conscious of any problems. Some issues may be hidden, which is a risk factor for the subsequent users. - Operationalization can be difficult
One reason you are trying to use available data is that it may be very difficult for you to even collect data on the phenomenon you are interested in. This is probably because it is difficult to measure whatever you want to observe. Using an available data set, which measuring something similar, can be the only way to go. For example, many business and economics researchers use patent data to measure innovation. This is usually considered a 'proxy' variable because it's the next best thing, although imperfect. - Gaps in data may exist
You should diligently go through the data set to identify any empty cases, or gaps of data. There might have been some corruption of the file, or difficulties in transferring the information from one source to another.
Reporting
Tables & Graphs
Spatial Maps
Descriptive Text
Synthesis Tables
Preferred Disciplines
Economics, Sociology, Geography, Political Science
Other Non-scientific Disciplines
Applications in Journalism, NGO reports and memoirs, lobby group analysis papers, marketing, geographic advertising, Legal Due Diligence, Crime investigation
Not so useful for
Historians, Psychologists, Anthropologists
References
Del Balso, M. & Lewis, A. D. (2012). First Steps, A Guide to Social Research. Nelson.
Neuman, W. L. & Robson, K. (2015). Basics of Social Research, Qualitative and Quantitative Approaches, Third Canadian Edition. Pearson.
No Comments