
Sensitivity Analysis
What is Sensitivity Analysis?
Sensitivity Analysis is a tool used in financial modeling to analyze how the different values of a set of independent variables affect a specific dependent variable under certain specific conditions. In general, sensitivity analysis is used in a wide range of fields, ranging from biology and geography to economics and engineering.
It is especially useful in the study and analysis of a “Black Box Process” where the output is an opaque function of several inputs. An opaque function or process is one which, for some reason, can’t be studied and analyzed. For example, climate models in geography are usually very complex. As a result, the exact relationship between the inputs and outputs are not well understood.
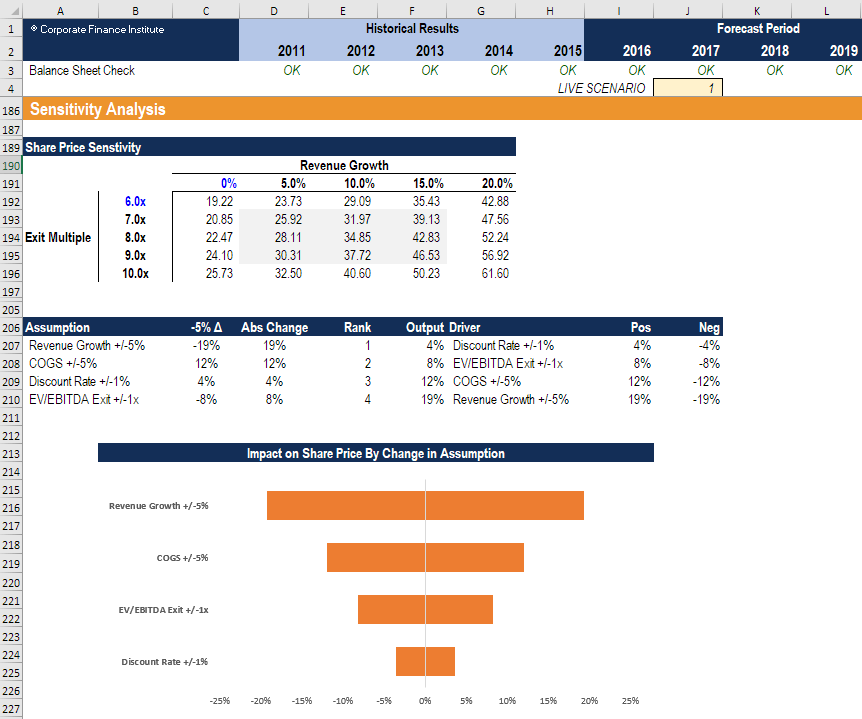
Image from CFI’s Scenario & Sensitivity Analysis in Excel Course
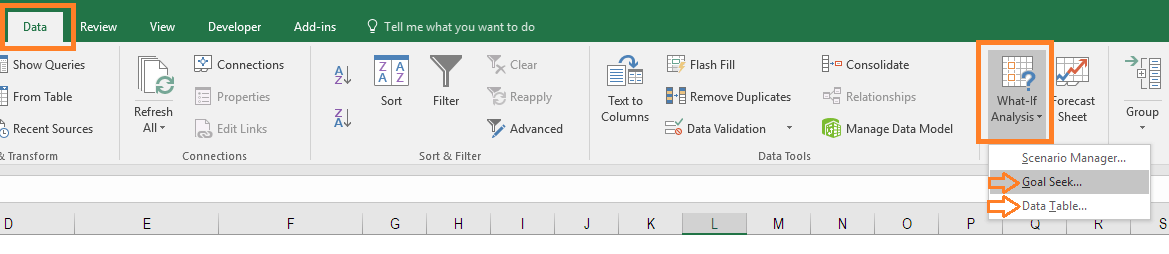
What-If Analysis
A Financial Sensitivity Analysis, also known as a What-If analysis or a What-If simulation exercise, is most commonly used by financial analysts to predict the outcome of a specific action when performed under certain conditions.
Financial Sensitivity Analysis is done within defined boundaries that are determined by the set of independent (input) variables.
For example, sensitivity analysis can be used to study the effect of a change in interest rates on bond prices if the interest rates increased by 1%. The “What-If” question would be: “What would happen to the price of a bond If interest rates went up by 1%?”. This question can be answered with sensitivity analysis.
The analysis is performed in Excel, under the Data section of the ribbon and the “What-if Analysis” button, which contains both “Goal Seek” and “Data Table”. These functions are both taught step-by-step in our free Excel Crash Course.
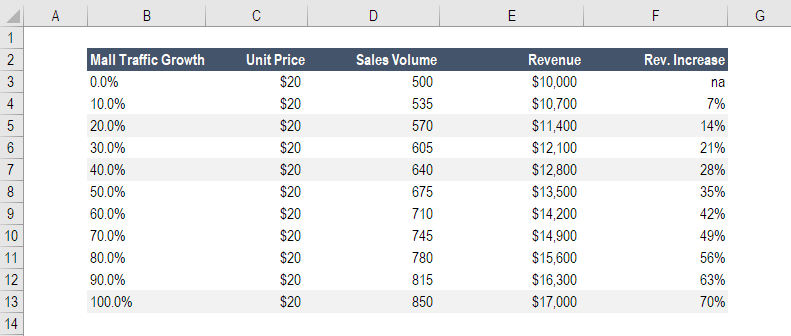
Sensitivity Analysis Example
John is in charge of sales for HOLIDAY CO, a business that sells Christmas decorations at a shopping mall. John knows that the holiday season is approaching and that the mall will be crowded. He wants to find out whether an increase in customer traffic at the mall will raise the total sales revenue of HOLIDAY CO and, if so, then by how much.
The average price of a packet of Christmas decorations is $20. During the previous year’s holiday season, HOLIDAY CO sold 500 packs of Christmas decorations, resulting in total sales of $10,000.
After carrying out a Financial Sensitivity Analysis, John determines that a 10% increase in customer traffic at the mall results in a 7% increase in the number of sales.
Using this information, John can predict how much money company XYZ will generate if customer traffic increases by 20%, 40%, or 100%. Based on John’s Financial Sensitivity Analysis, such increases in traffic will result in an increase in revenue of 14%, 28%, and 70%, respectively.
No Comments