
Challenge 4C - Creating Graphs
Building graphs to communicate your results
-
Required Deliverables:
- Basic Graphs - From the questionnaire portion, copy the graphs, rewrite the questions and make it consistent through out your template. Remove all overlaps or cropped information.
- Basic Graphs - For the focus group, unite all of the interview questions, procedure and findings.
- Combined Graphs - Build a minimum of 5 graphs based on the information, use crossing such that put together the significance of two or more questions and then generate your results. Age and Ethnicity allows you to figure out segments of people.
- Strategic Graphs - Build 5 charts or graphs to represent your overall thesis, something high level.
- Targeted Graphs - For each hypothesis, build 3 charts or graphs that defines the results.
Resources
- Word Clouds : https://www.jasondavies.com/wordcloud/ wordcloud.svg
- https://www.freewordcloudgenerator.com/
- https://flourish.studio/
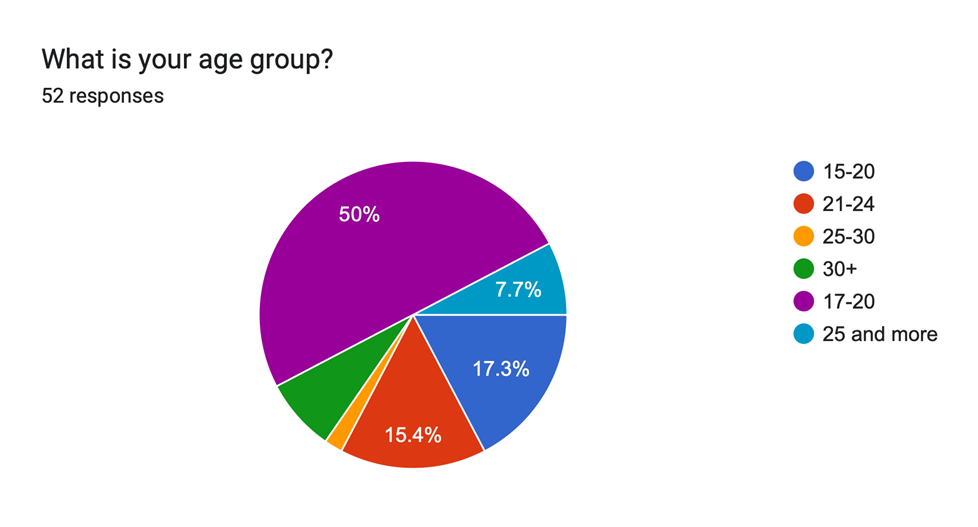
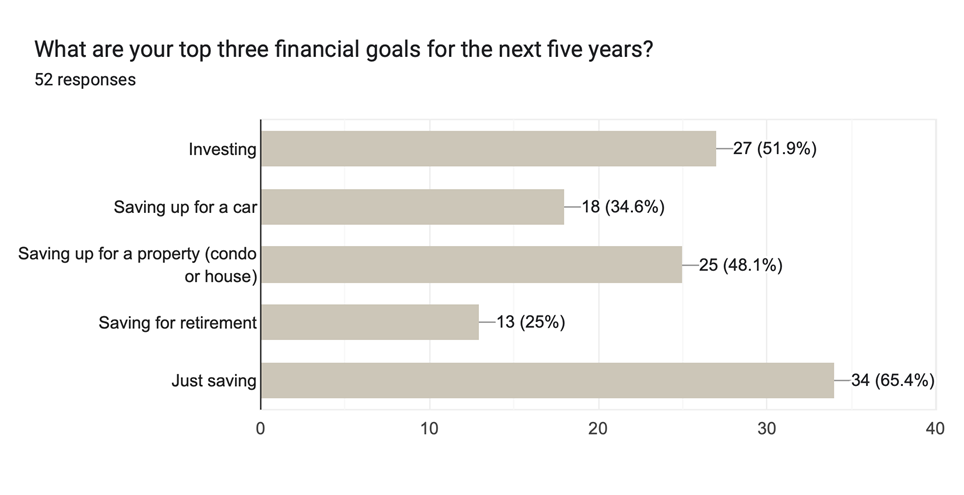
Basic Graphs
Basic graphs are pulling directly from your current data collected.
If you are using google forms, you will see them created in your responses panel.
Youth and Personal Finances; A Love and Hate Relationship by Helen Charles, Francesco Arcuri, Rozhin Mohammadi, Maxime Giroux
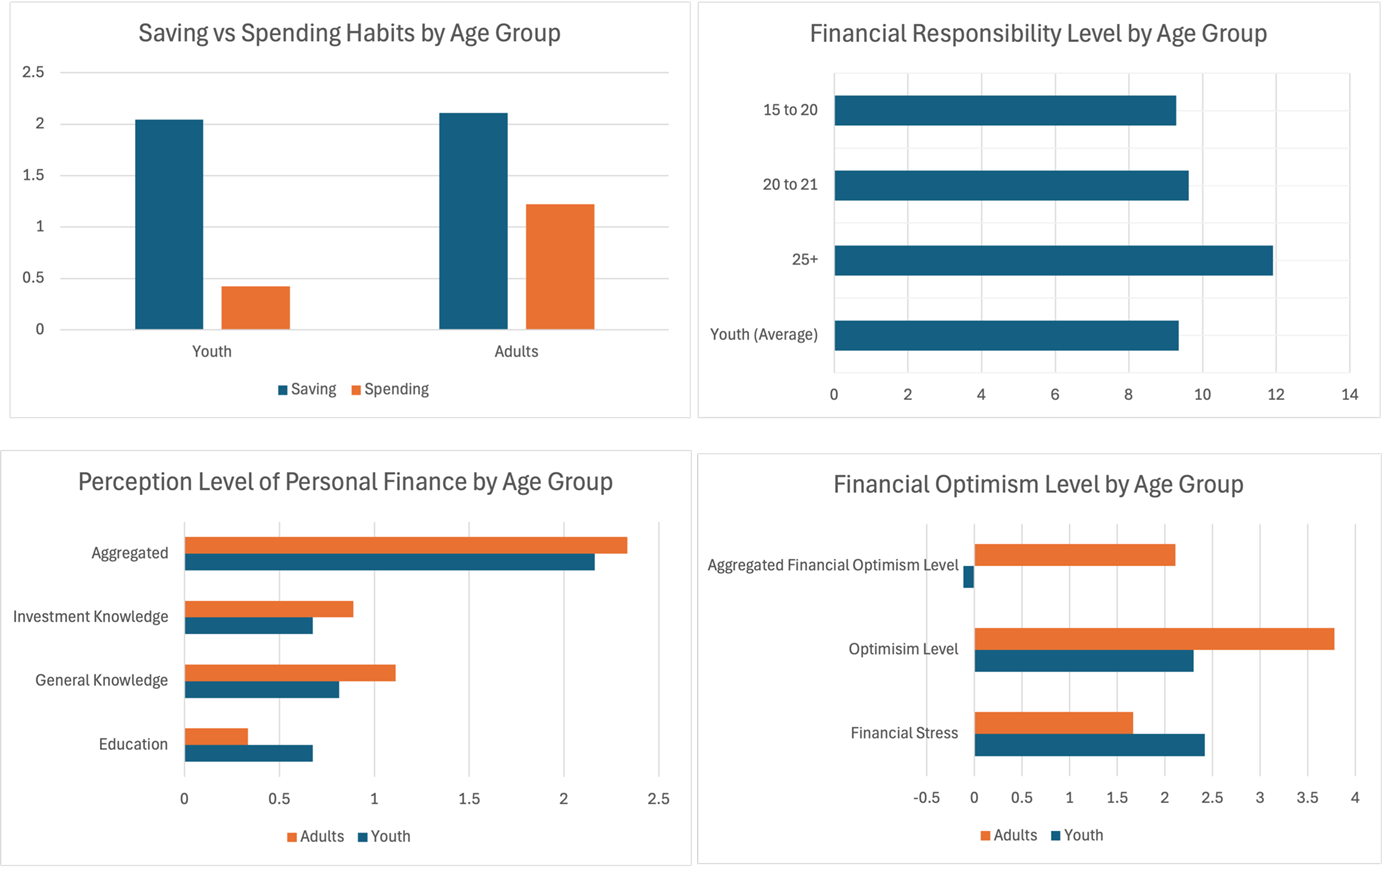
Combined Graphs
Combined graphs used the date that you have collected, put them into an excel file, and then combine the insights to extract something new. These are not ready made, you will have to build them yourself.
Strategic Graphs
If you were to summarize the most critical points of your thesis, these graphs should give the audience a good picture.
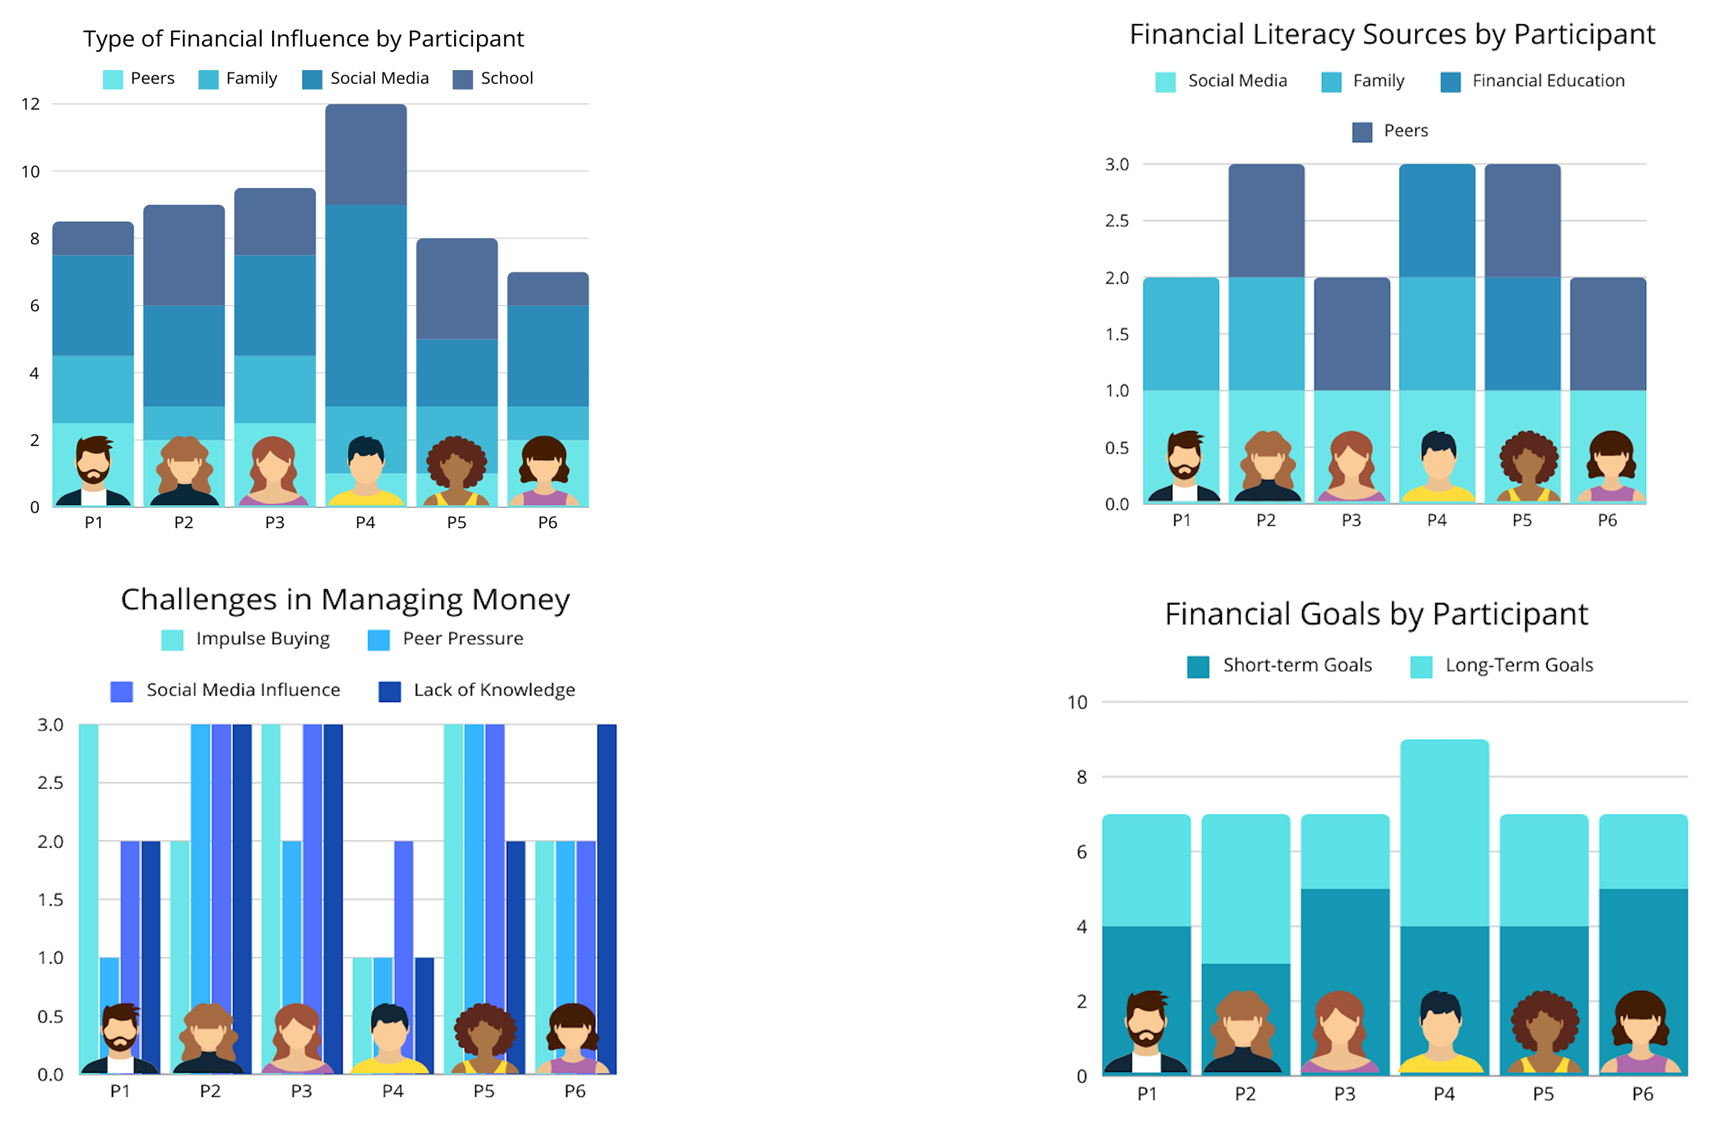
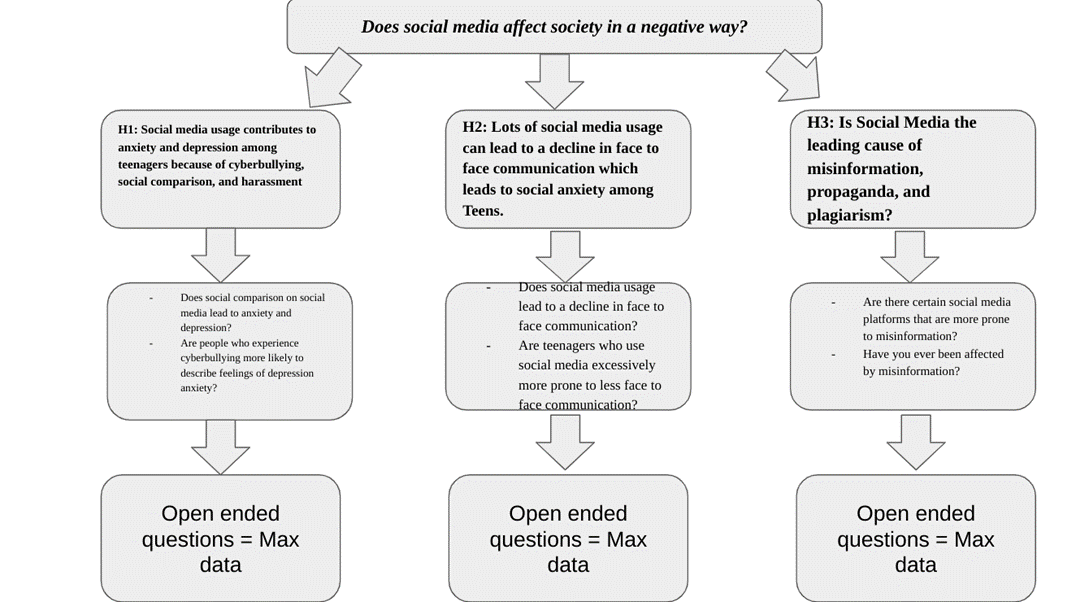
Targeted Graphs
For each hypothesis, build 3 charts or graphs that defines the results.
Example of the thesis diagram, from Social Media by Katlynn F. Willis
No Comments