
Advanced Applications of the Production Possibilities Frontier
Why Should I Care?
The Production Possibilities Frontier (PPF) model can be used to discuss many issues. Here are some advanced applications of the model as it relates to issues of Economic Development, Industrial Structure and International Trade, and Ecological Transition.
This lesson has 4 parts
- Economic Growth
- Industrial Structure and International Trade
- Ecological Transition
- Mathematical Application
What are Advanced Applications of the PPF?
The PPF model can be adapted to several types of economies. This is done by relaxing or modifying assumptions that determine the shape of the curve, or by changing the scope of the variables on each axis. The curve will always be downward sloping, indicating an opportunity cost for substituting one good over the other. The shape of the curve will change according to the assumptions made.
-
Economic Growth
A main tenet of the Austrian School of economic thought is that economies grow thanks to productive investment. For example, all spending is not productive. If a consumer purchases a race car for their personal pleasure, it will not affect their productivity in the workplace. If a company spends their profits on luxury office furniture for the executives, this does not help to produce more on the factory floor. Austrian economic thought is very much in favour of entrepreneurship and free markets, and heavily influenced by its geography, being located near both German capitalism, and Russian communism.
Economic growth is thus a result of increased capacity, mostly through the accumulation of physical capital.
Graph 1 - Investment in Capital Goods
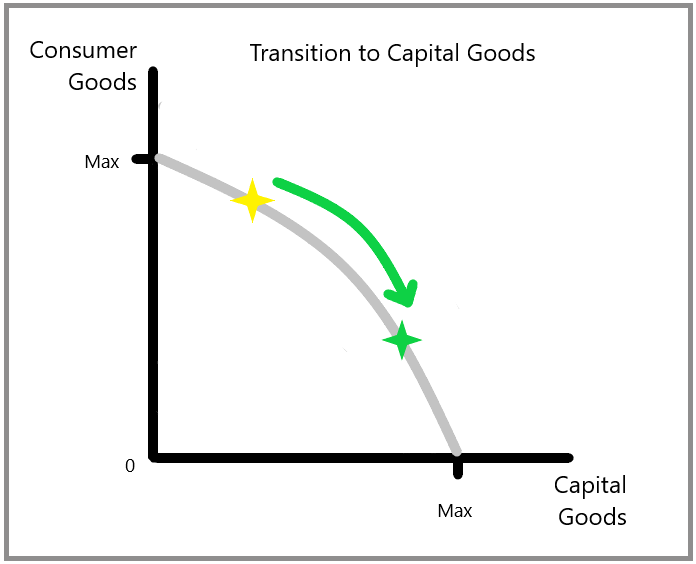
The first step is to transition the economy towards the production of capital goods, such as machines, equipment, tools, computer hardware and software, as well as public infrastructure such as energy utilities, roads, ports and railways. This will reduce the comfort and convenience of the general population, but will allow all of the industrial sectors to increase production later.
The second step is to take advantage of the increased production possibility in both sectors. In the end, an increase in consumer goods can be achieved, while keeping the economy focused on improving technology and capacity, for a continued long-run cycle of economic growth.
Graph 2 - Increased Capacity for both industries
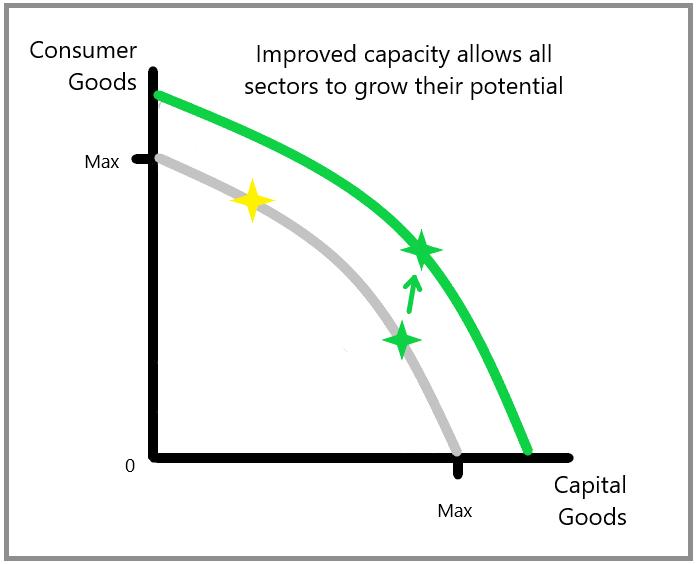
This situation can be the result of a government policy to encourage capital stock formation and discourage consumer good production. It can also be the result of the introduction of new radical technologies. This is the case for many major shifts in technology, such as the advent of coal power, electrical power, or computers. If the graph is depicting the industries of making automobiles, and building homes, it could be argued that the advent of electricity would improve the productivity of both industries.
The main point that this theory is making is that developing economies can benefit from focusing their efforts on productive capacity first, and that the spoils of consumerism can follow later.
-
Industrial Structure and International Trade
The PPF model originated in a discussion on international trade and the importance of free trade, as opposed to protectionism. This is a topic you can read about in later sections of the manual. The PPF has originally designed to continue the arguments of David Ricardo's theory of Comparative Advantage.
In its essence Ricardo argues that nations should specialize in one, or a few, industries, and trade with partners to complete their needs of other goods. Each nation should concentrate on the goods for which their opportunity cost is the highest. The PPF can offer an argument for this if we suppose there are important economies of scale at play in each country. Economies of scale are cost reductions that occur when companies produce in large quantities. Most car producers, for example, can be competitive only if they mass produce units.
For this example, we will consider labourers to be perfectly substitutable, and firms to operate with important economies of scale of production. This means that firms will only operate if they produce large quantities. We will also assume that one industry is concentrated in one country, and that the other industry is concentrated in another country.
Graph 3 - Economies of scale and trade
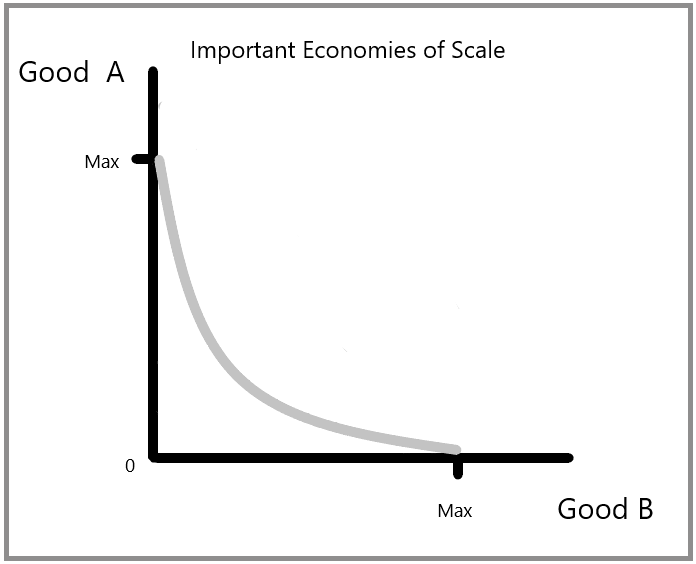
As you can see on the graph, the curve is now convex. In this situation, country A, making good A, would benefit from specializing in this production, and trading with country B, who would be specialized in production of good B.
An example of this would be the specialization of the provinces of Ontario, and Quebec due to the Auto Pact of the 1970's. In this arrangement, Ontario became the largest producer of automobiles in the country, having attracted the US corporations. Quebec could have developed an auto industry, but agreed to specialize in aerospace, dairy farms, and textiles. Both automobile and aerospace are subject to important economies of scale. This means that Canada is too small a country to have airplane production in both provinces, and auto production in both provinces. In this case, Quebec produces airplanes (Bombardier), and trades them for Ontario automobiles (GM, Ford, Chrysler).
This analysis is limited by many factors which we will discuss in the section of the manual about International Trade. Keep in mind that much of our trade may not be subject to economies of scale of this magnitude, and that trade usually helps to diversify economies in the long run.
-
Ecological Transition
We can use the PPF model to discuss the transition costs of substitution between industries. The main issue here is that oil industry workers are worried about having a job if the oil industry is banned, or at least stemmed from any further developments.
The graph below shows that the transition towards renewable energy does not mean the elimination of the oil sector. We would still need a good amount of production for many objects of our daily life, such as plastics, lubricants, and construction materials. The graph also shows that the renewables sector would require a good amount of jobs. Hypothetically, maybe even more, but let's say there would not be any loss in economic potential and need for resources.
Graph 4 - Transitioning out of Oil
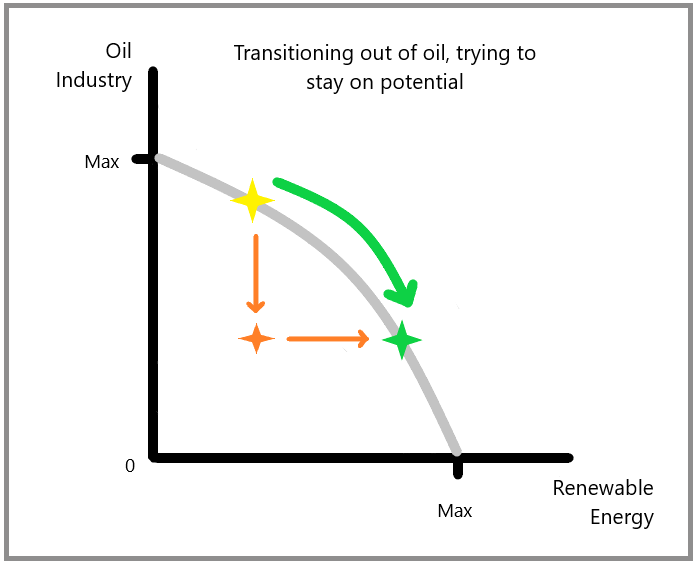
If the transition follows the green path, workers in the oil industry would be retrained and hired into the renewable energy sector. Some workers might be able to retire without having to retrain, and some of the younger workers would be able to train directly for the renewables energy sector. Middle-aged workers would have to go back to school, and this would require some help from family, community and the government.
What the oil workers are worried about is the orange path. They are worried that the transition will not happen smoothly, and that their career, and their local economy will be stuck where you see the orange star. This represents high unemployment and idle resources. The more planning and help with training goes into this transition, the closer the economy will stay on track with its potential.
The government has no incentive to plan for a messy transition. The closer the economy stays to potential, the more income is earned by workers, and the more taxes are collected by the government.
-
Mathematical Application
The PPF models allows to calculate the opportunity costs associated to several combinations of production of two goods.
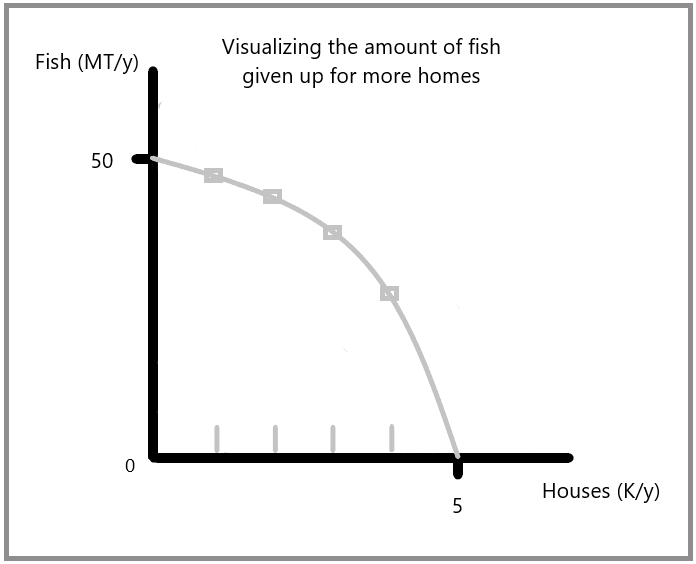
Given the following equation, solve for the coordinates and draw the curve of the PPF
y = 50 - 2x2
where y = fish production, in millions of tons per year, and x = residential homes production, in thousands of units per year
Replace the x, by an integer, to solve for y.
For example, if x = 0, then y = 50 - 2(0)2 = 50 - 0 = 50
| x (homes) |
y (fish) |
| 0 |
50 |
| 1 |
48 |
| 2 |
42 |
| 3 |
32 |
| 4 |
18 |
| 5 |
0 |
These are the coordinates for the graph. When you draw the graph it should look like this.
Examples of opportunity cost calculations.
- If the economy moves from producing 3,000 homes per year, to 4,000, how many fish does it have to go without?
Answer: At 3,000 homes per year, the economy can produce a maximum of 32 million tons of fish per year. At 4,000 homes, the economy can only produce 18 million tons. In this instance, the opportunity cost of adding 1,000 homes, is to reduce fish production by 14 million tons, which is almost half.
- If the economy moves from 1,000 homes per year to 2,000 homes, is it worth it?
Answer: Yes. You can double the production of homes, and fish production will drop only slightly. Fish output would go from 48 million tons per year, to 42. If this means more housing for people, than yes, it is worth it.
No Comments