
The Costs of Production
Why Should I Care?
Compare clean water and diamonds, which is more expensive? Which is more important? Understanding the meaning of value, and how prices are set, may unlock the often-frustrating mysteries of market prices.
This Lecture Has 5 Parts
- Accounting Costs
- Opportunity Costs
- Production Possibilities
- Cost-Benefit Analysis
- Positive and Normative Principles
What are the Costs of Production?
The price of a final product includes all the costs associated to its production. These are Accounting Costs. Obviously, if the costs increase, so too will the price of that product. A basic law of business is that it is very difficult to sell a product below its accounting cost price.
But there is more to the story than these costs. Economists insist economic choices must be taken into consideration. Most people have to make choices, so when they do, they sacrifice one option for another. These Opportunity Costs tell us the true reasons we choose to produce/consume one thing rather than another.
-
Accounting Costs
The final price of a good or service must include all the costs associated to its production. These are also called “cost-price”, or “accounting” costs.
For example, the price of an iPhone must cover the cost of raw materials (land) such as minerals, plastics and electronics, as well as the labour entailed in assembling and delivering the product, which incur more land distribution costs associated to travel and retail outlets. On top of that, the price of an iPhone must also cover the cost of machinery, buildings and intellectual property (physical and human capital).
Finally, the price also covers a profit margin (entrepreneurship) for those who designed, organized production, paid the transportation costs, etc., which in this case is Apple, Inc.
Consider that a final product is worth more than the initial value of the raw materials. Each new resource, each modification, each part assembled to the whole, and each transformation adds value to the previous product. This idea is called “Added Value”.
Buyers are also usually willing to pay more for transformed products that are more useful. Producers can charge extra for “some” profits because organizing production adds value to the set of resources. Would you prefer to live in a house that is assembled and functional, or in a tent next to a container filled with building materials you need to assemble? The house, you would prefer the convenience of a turn-key home, rather than months of assembly!
The Paradox of Value
All in all, valuable products tend be expensive. But there are important exceptions. Prices don’t necessarily reflect the social value of an object. This is a paradox many economists have written about.
For example, a 1 gram diamond (5 carat) is worth more than the same weight or volume of water. In fact it is worth more than 40,000 $. But water is more important to our well-being than diamonds. Same goes for air, food, shelter, and clothes. In our opinion, societies tend to do better when the important things of life are very much affordable, or free.


Adam Smith was one of the first philosophers to discuss, and differentiate, the various meanings of value. First, value comes from the transformation of inputs into output, which can only be done with labour, an important concept later used extensively by Karl Marx. Second, value can come from the utility we get from an object, no matter how much or little labour was needed to produce it. Third, value can come from an object's ability to be used for exchanges, on markets.
"The things which have the greatest value in use have frequently little or no value in exchange; and, on the contrary, those which have the greatest value in exchange have frequently little or no value in use. Nothing is more useful than water: but it will purchase scarce anything; scarce anything can be had in exchange for it. A diamond, on the contrary, has scarce any value in use; but a very great quantity of other goods may frequently be had in exchange for it''
(Smith, 1776, Book 1, chapter IV).
-
Opportunity Cost
For most people, the cost of producing something is measured by the cost of the resources used to make the good or service. However, economists insist on including the cost of what is given up, when we choose to produce something. The idea of this hidden cost is present in human thought since time immemorial, but was formalized in 1914 by the Austrian economist von Wieser.
For example, economists compare the cost of making iPhones, with the cost of using those resources to make something completely different, like tomatoes. If you buy an iPhone worth 500 dollars, you have to realize you also gave up 1,000 tomatoes.
Economists insist on measuring this “opportunity cost” of what we give up when we choose to produce something else. The opportunity cost is the next best alternative sacrificed when making a choice.
Say you have to give up two months of eating premium ice-cream to buy one pair of shoes. The Opportunity Cost of the shoes is X tubs of ice-cream.
This concept is important because there are more costs to doing something, than the sum of the cost of the resources used to make that item.
Another example: if the government builds a hospital for 5 billion dollars, it has no money left to build hockey rinks. So the cost of the hospital is not just 5 billion dollars, it’s also the absence of a cultural infrastructure.
-
Production Possibilities
Individuals have to choose what to buy, because they have a budget limit and they can’t buy everything they want. Well, so do societies. We can use an economic model to understand this situation.
Model – Production Possibilities Frontier
- Definitions
- Maximum production of Good A is set on the vertical axis.
- Good B is set on the horizontal axis.
- The curve represents maximum production levels according to different combinations of goods A and B.
- Assumptions
- An economy produces only two goods.
- All the workers can work on any of the two goods, but only one at a time.
- There are no economies of scale.
- Workers are (not) equally productive at making each good.
- Hypotheses
- The maximum production level is shown on the Production Possibility Frontier (PPF).
- Predictions
- The PPF is straight (concave).
- The economy will produce more with trade (local diversification).
This first graph shows the combinations of goods A and B, that are possible to produce, or impossible to produce. The simple model assumes that resources can be shifted from one industry to the next without any difference in productivity.
Graph 1 - The Production Possibilities Frontier
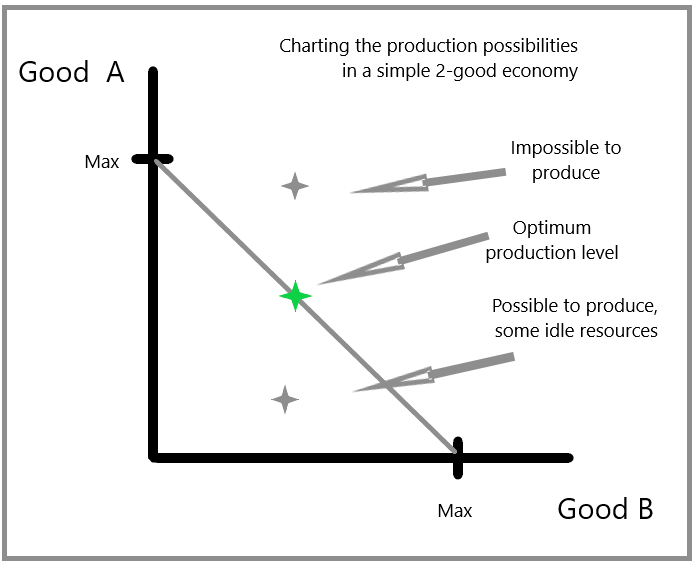
Points on the graph represent a combination of production in good A, and good B. Any point above the PPF curve represents a combination which is impossible to produce. Any point below the curve is possible to produce. In this case resources go idle, most importantly labour. This type of unemployment and underemployment is a complicated issue.
Also, it is interesting to note that the slope of the PPF curve represents the opportunity cost of adding one unit of Good B. The more specialized the economy in Good B, the higher the loss of Good A. Economists call this the Law of Increasing Opportunity Costs.
The next graph shows how a change in technology, or capacity, will be analyzed using this graph.
Graph 2 - A Change in Technology or Capacity
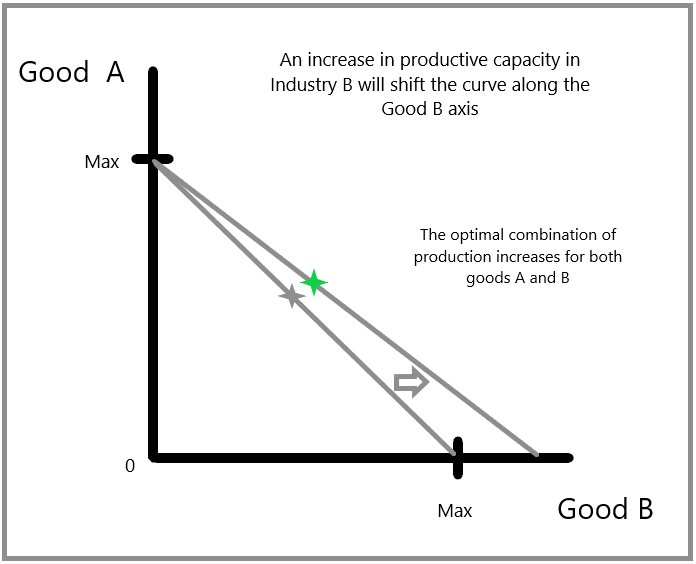
In this case, the curve has shifted to the right, because there is an increase in productive capacity. This can be because of a new technology which allows to produce more, or the addition of more resources such as labour or minerals.
If capacity were reduced, such as in the case of a natural disaster destroying a plant, or a union strike reducing available labour, then the curve would shift left towards zero.
The end of result is that the optimal level of production will shift, and most likely see a change in the production of both goods. When the change is positive, you will likely see more production of both goods. When the change is negative, you would likely see less production of both goods.
Given this principle, if a society wishes to expand its economy overall, it should invest massively in productive endeavours, such as improving physical and human capital. In this case, the whole curve would shift outwards. This is a major insight for Austrian economists who insist on the importance of productive investment to grow output.
The next graph shows what happens if we loosen an important assumption, that workers are all the same. What if workers have different skills and aptitudes?
Graph 3 - Production Possibilities with Diversity
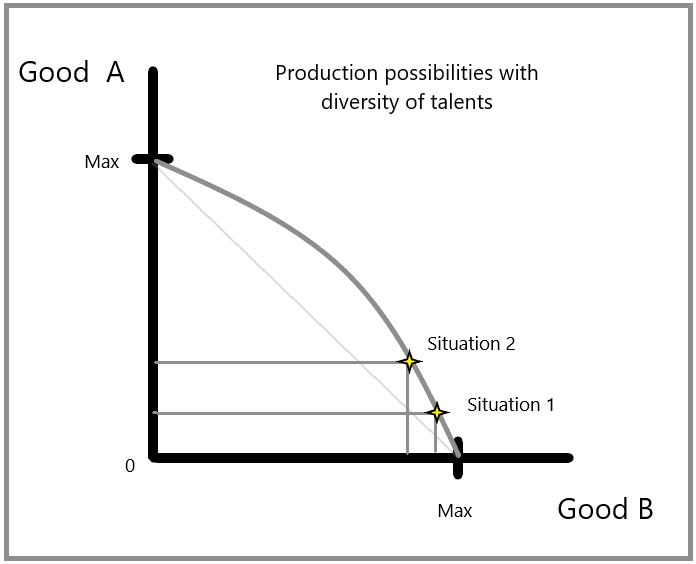
How can we model the diversity of talents in the labour force? A simple assumption is to say that if a worker is really good at making Good A, they are not very good at making Good B, and vice versa. You can assume that the difference between their talents varies amongst workers, where, in an extreme case, one worker is really really productive at one product, but really really non-productive at the other product.
On graph 3, situation 1 refers to a combination of production where the economy is making alot of Good B, and very little Good A. This is a specialized economy. If this economy decides to increase production in Good A, they must reallocate resources. If people are not the same, who would you send from the factory B, to factory A?
You would probably send the workers who are not very productive in factory B. Our assumption is that if someone is not productive in one setting, they must be more productive in another setting.
What this means is that opportunity cost for increasing production of Good A is very low. The economy loses a little bit of Good B, in exchange for a large increase in Good A.
Many economists believe that, in general, the curve is not a straight line. Why? Because they believe that workers are not the same, they have specialties. If you assume that workers don't share the same expertise, the same skills, and the same competencies, then some workers are more productive than others. The result is that the system is optimized when it produces a variety of goods. This works if you assign work according to people’s strengths. If you allocate the productive workers to their best industry, obviously, the system becomes more efficient. In other words: division of labour according to workers’ specialties generates higher overall production. This is why some economists believe the system would produce more goods and services if you strike a balance in the quantity of different goods to produce.
An Austrian Model
The PPF model is widely known as a building block of the Austrian School of Thought, which notably contributed the concept of opportunity cost. Many credit Haberler with the first rendition of the PPF, in an article written in German in 1930 (Lerner, 1932).
The origin of this model is not clearly cited in most textbooks. A 1941 paper by Stolper and Samuelson regards the model as being well-known under the names of 'substitution curve', 'production indifference', or 'transformation curve'. The model was first designed to argue for the specialization of production amongst openly trading nations. Assuming that economies of scales are not dominant, and that labour is diverse in its abilities, the model can be used to argue in favor of open trade albeit with diverse local economies. This said, assuming important economies of scale, and that other factors are constant, the diversity argument fades, and nations (or local economies) benefit from specialization.
-
Cost-Benefit Analysis
An important tool used by managers, policymakers, and economists, is called Cost-Benefit Analysis (CBA). In simple terms, this tool compares the sum of the costs of a project to the sum of its benefits.
The costs include both the accounting costs, which are usually measured in dollars, and the opportunity cost and social costs, such as health and environmental issues, which are qualitative in nature.
The benefits include tangible effects, revenue streams, asset valuation, again quantifiable, but also intangible benefits such as social welfare, consumer surplus, and political capital, which are qualitative.
The scope of the analysis depends on who is deciding on the project. For a private profit-seeking firm, the sum of costs include mostly the quantifiable accounting costs. Firms do have to think of opportunity costs, such as other projects they could finance, and reputation risks associated to each project. Firms are often free to exclude quantifiable social costs from their analysis. Governments are usually more likely to include the social costs because they will likely be liable for them.
Putting a lid on the Big O
The Quebec government owns the Olympic Stadium in the East-End of Montreal. The facility does not have a roof, and would need one to be useful for hosting sporting events and music concerts. A contract was awarded for 729 M$ to Pomerleau-Canam for the new roof, which includes a see-through dome so that natural sunlight, or a starry sky, can shine into the stadium. The total budget for the project is 870 M$.
There are three scenarios for the stadium:
1- Demolish the building, with an estimated cost of 2,000 M$.
2- Status Quo, where the stadium is closed for winter, cannot hold large events and incurs winterizing costs for its systems (heating, cooling, plumbing, screens, etc).
3- New roof, costing 870 M$, allowing year-round use and increased revenues.
Questions:
Are there important social costs to building a roof?
Are there important social benefits to building a roof?
What could the government do with 870 M$ that would be as important, or more important, than a new roof?
https://www.cbc.ca/news/canada/montreal/gcpc-olympic-stadium-roof-1.7137039
https://parcolympique.qc.ca/remplacementtoiturestade/
-
Positive and Normative Principles
Positive:
There is an opportunity cost to shifting production from one industry/sector to another.
Normative:
Economies should aim to produce at capacity, so as to avoid leaving resources idle.
Economies should aim to produce a variety of goods to maximize both utility of consumption, and productivity of diverse labour resources.
Green Policy
The biggest ecological problem created by our economy is that we are polluting the natural environment, and the clean-up costs are either ignored or left to younger generations to bear. These clean-up costs are usually unaccounted for in the market price of a product.
However, there is a way to measure the true cost of producing, and disposing, of product. This is called Life-Cycle Cost, which we obtain from using a Life-Cycle Analysis. If you had to pay the full cost for waste clean-up, or recycling, of everything you purchase, you might make drastically different decisions as a consumer!
The Green Playbook is fairly clear on this issue. Environmental debts are just as costly as financial debts. They must be paid back. And better yet, it’s always better not to contract any debts at all in the first place. Imagine the money we would save if we did not have to clean up our own messes.
The other thing industrial lobbies forget to mention is that the opportunity cost of not having a planet to live on is incalculable. There is no other option. So whatever the cost of cleaning up rivers, ponds, streams, wetlands, lakes, abandoned gas stations, and old mining sites (there are hundreds in Quebec alone), it’s worth it.
If that argument is insufficient, one may also add the accounting cost of modern life. Trees provide clean air, cooling, fruits, teas, and building materials at a very low cost, compared to oxygen tanks, air conditioning machines, imported produce and foods, and producted materials like plastics and metals. Modern life is quite expensive!
Imagine how much accounting costs could be saved by large cities if they did not have to clean the water that runs to your home.
Climate Change Solution
The problem with Climate Change is that it’s not really a debt that we can leave to younger generations indefinitely. We are not talking about a lake that needs to be cleaned so that our grandchildren can swim in it. If we don’t clean the lake, my kids won’t be as happy, but their livelihood is not at stake.
Climate Change is happening now, so we need solutions that are not minded towards generational equity, but towards saving our entire species. The good thing is that the opportunity cost argument is actually quite useful. The opportunity cost of not having a planet to live on is incalculable. There is no other option. So whatever the cost of reducing GHG in the atmosphere, it’s worth it.
Another point many Green Economists make, and industrial lobbyists seem to ignore, is that Green production can, does and will, create jobs. We will get back to this later. But keep in mind that cleaning the earth does not have to be done at the cost of our incomes and livelihoods. Using the PPF model, one can argue that shifting the economy out of oil production, for example, does not necessarily imply a reduction of economic activity, but rather a shift from one industry to another.
Democracy Booster
World-wide surveys are clear. People want an end to Global Warming. Whether it’s floods or hurricanes, or incredible heat waves, humans have already had enough of the consequences. So why are politicians not on board? It’s a complicated question. But the main reason is that some countries benefit from producing oil, like Canada and the United States of America. Most other countries are poor, and geographically more vulnerable to Climate Change. In essence, the South does not have the power to force the North to change.
Giving a louder voice to those who have the most to lose is the most economically rational thing to do. This is what economists usually argue in favor of. In a conflict, the winning hand should be given to the party who has the most to lose, whose opportunity cost is the greatest. In other words, let the guys who don’t have many choices get a break.
Of course, that is probably not going to happen.
Another solution would be to tie foreign trade agreements to GHG-reduction agreements. Countries who refuse to reduce their GHG emissions will see their export production banned, taxed, or curtailed by quotas, by the countries who suffer the most. We can get back to this solution later when we discuss international trade.
Wrap-Up
The price of resources needed to provide a good or service does influence the cost of production. When you transform resources and sell for a higher price, you add value.
Economists insist that the true cost of a product must also include the forgone possibility of consuming something else. This is the cost of lost opportunity.
The opportunity cost can be modelled on the Production Possibility Frontier, which helps to illustrate that variety leads to an optimal level of production.
Cheat Sheet
Added Value:
Buyers are willing to pay more for transformed products that are more useful. Producers can charge more because that transformation incurs added costs.
Opportunity Cost:
The next best alternative sacrificed when making a choice.
PPF:
A curve that represents the maximum production of an economy. The slope of the curve represents the opportunity cost of producing one more unit of Good B.
Division of labour:
Assigning specific tasks to workers according to their strengths.
References and Further Reading
Fagan, M. & Huang, C. (2019). A look at how people around the world view climate change. Pew Research Center. https://www.pewresearch.org/fact-tank/2019/04/18/a-look-at-how-people-around-the-world-view-climate-change/
Haberler, G. (1930). Die Theorie der komparativen Kosten und ihre Auswertung für die Begründung des Freihandels. In Selected Essays of Gottfried Haberler, volume 32, p. 3 - 19.
Lerner, A. (Aug., 1932). The Diagrammatical Representation of Cost Conditions in International Trade. Economica. No. 37, pp. 346-356.
Mishan, E. J. & Quah, E. (2020). ‘‘Brief historical background to cost-benefit analysis,’’ in Cost-Benefit Analysis, 6th edition, Routledge. 9781351029780
Pimonenko T., & Chygryn O. (2019). Approaches to Define Environmental Debt in the Framework of Sustainable Development. In: Leal Filho W., Azul A., Brandli L., Özuyar P., Wall T. (eds) Responsible Consumption and Production. Encyclopedia of the UN Sustainable Development Goals. Springer.
Smith, A. (1776). An Inquiry into the Nature and Causes of the Wealth of Nations. London: W. Strahan and T. Cadell.
Stolper, W. F., & Samuelson, P. A. (1941). Protection and Real Wages. The Review of Economic Studies. Vol. 9, No. 1, pp. 58-73
von Wieser, F. (1914). Theorie der gesellschaftlichen Wirtschaft (Theory of Social Economy).
|
Drop this name to impress. The Austrian economist Friedrich von Wieser coined the term ‘opportunity cost’ |
1 Comment
Very cool graphs! If you want to hide the grid, you can do it through desmos. Right side of the graphing calculator - click on the wrench, and unclick grid.