
A/B Testing
One of the main tools in the arsenal of conversion optimization is A/B testing.
A/B tests “consist of a randomized experiment with two variants, A and B. It includes the application of statistical hypothesis testing or ‛two-sample hypothesis testing’ as used in the field of statistics. A/B testing is a way to compare two versions of a single variable, typically by testing a subject’s response to variant A against variant B, and determining which of the two variants is more effective” (Wikipedia).
In plain language, an A/B test compares two versions of the same webpage where one element differs (e.g., a different call to action, background image, or heading). Using software solutions, half the traffic to this webpage over a specific period of time is sent to version A and the other half is sent to version B. Then the performance of both pages on whatever goal consumers were supposed to achieve on this page is compared.
Let’s take the following landing page (Figure 8.4), for example. The signup rate is lower than expected, and the firm wants to test different elements of the page. Their first hypothesis is that the headline is not convincing enough. They thus decide to test a different headline with a clearer call to action: “Transform yourself with Fit for Life” instead of “It has just become easier to develop your fitness potential.”
Figure 8.4 A/B Test
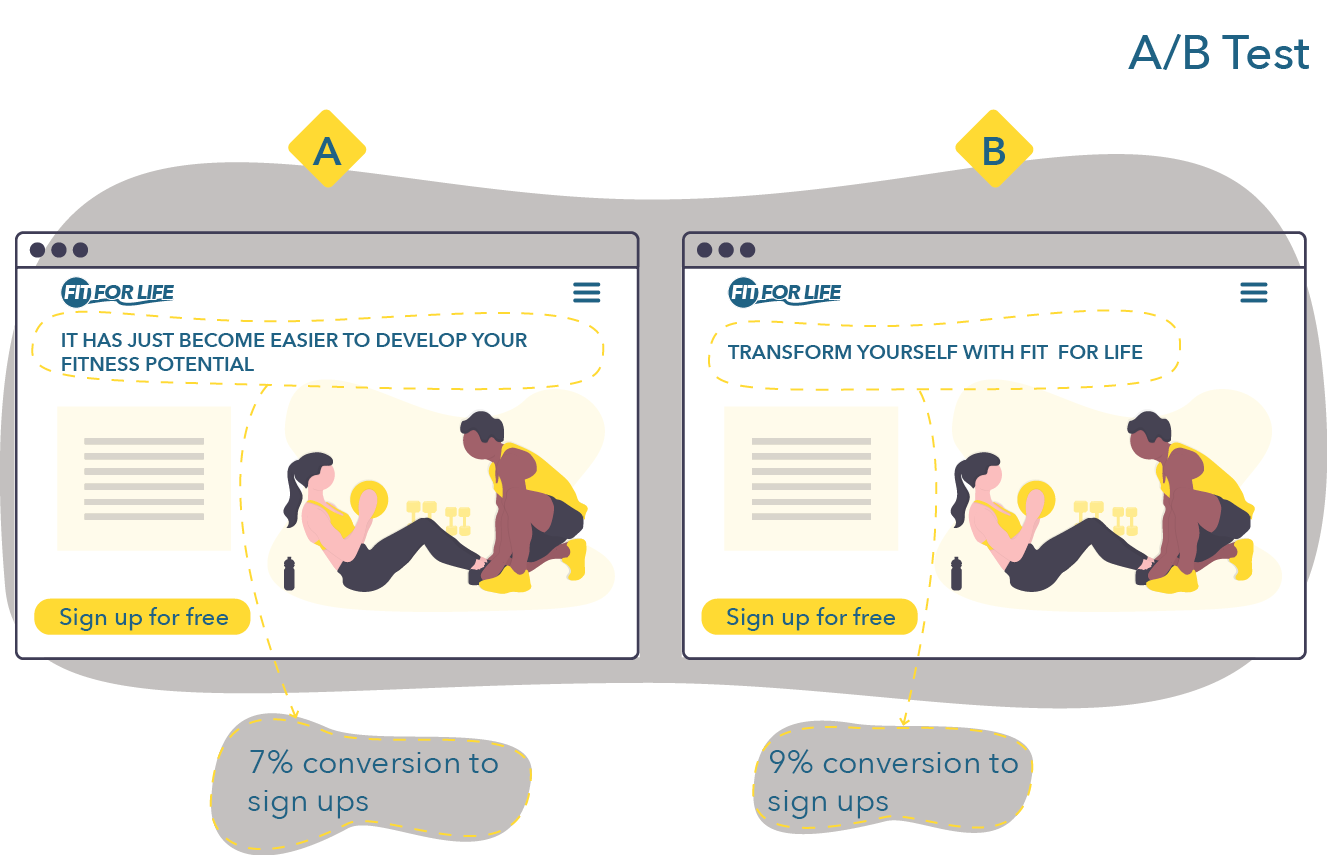
They test both pages over a period of a week. After the week ends, they compare version A and version B and find out that version B performed better. They thus keep version B and move on to testing other elements of the landing page.
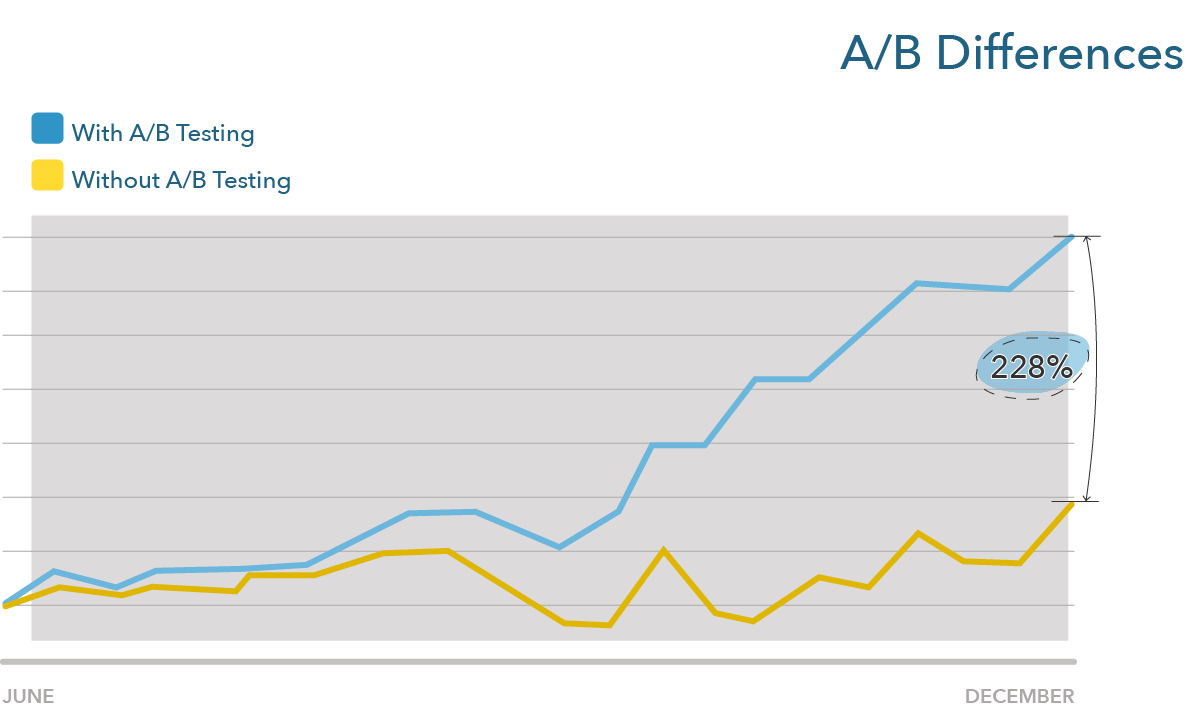
Optimizing through A/B testing typically leads to marginal gains, meaning that it is rare to see a massive difference between two versions. But, over time, these marginal gains can add up to important differences. For example, let’s compare a website that does not do any A/B testing on a landing page to one that does A/B testing every week and makes small gains, improving their conversion rate by a factor of one percent a week (e.g., moving from 8% to 8.08% in the first week). The second website, at the end of the year, will have a page that performs 1.39% better. At the end of the second year, 2.97% better. At the end of the third year, 4.76% better. While the first landing page still converts, let’s say, 10% of visitors, the second landing page now converts 14.76%. If the improvements are by a factor of 2% per week, this difference moves to 21.77%. Like compound interests, small differences add up to large differences over time (Figure 8.5).
Figure 8.5 A/B Differences (adapted from Optimzely)
Anything can be A/B tested. If you want more information on how A/B tests can be used in practice, I highly encourage you to read one of the following three case studies from Optimizely:
- how Secret Escapes A/B tested a mandatory signup for an app
- how Sony A/B tested a banner ad and a cart
- how ComScore tested social proofing (testimonials on product pages) (note: ComScore used multivariate testing rather than an A/B test by testing three variations of their page)
No Comments