
Understanding What to Optimize
To manage optimization, firms should first examine the general path of a specific persona as they move from visitor to lead to customer. This gives an overview of the strategic picture of our overall conversion efforts. Trew Marketing provides us with an abstract funnel as shown in Figure 8.2 (text here).
Figure 8.2 Funnel
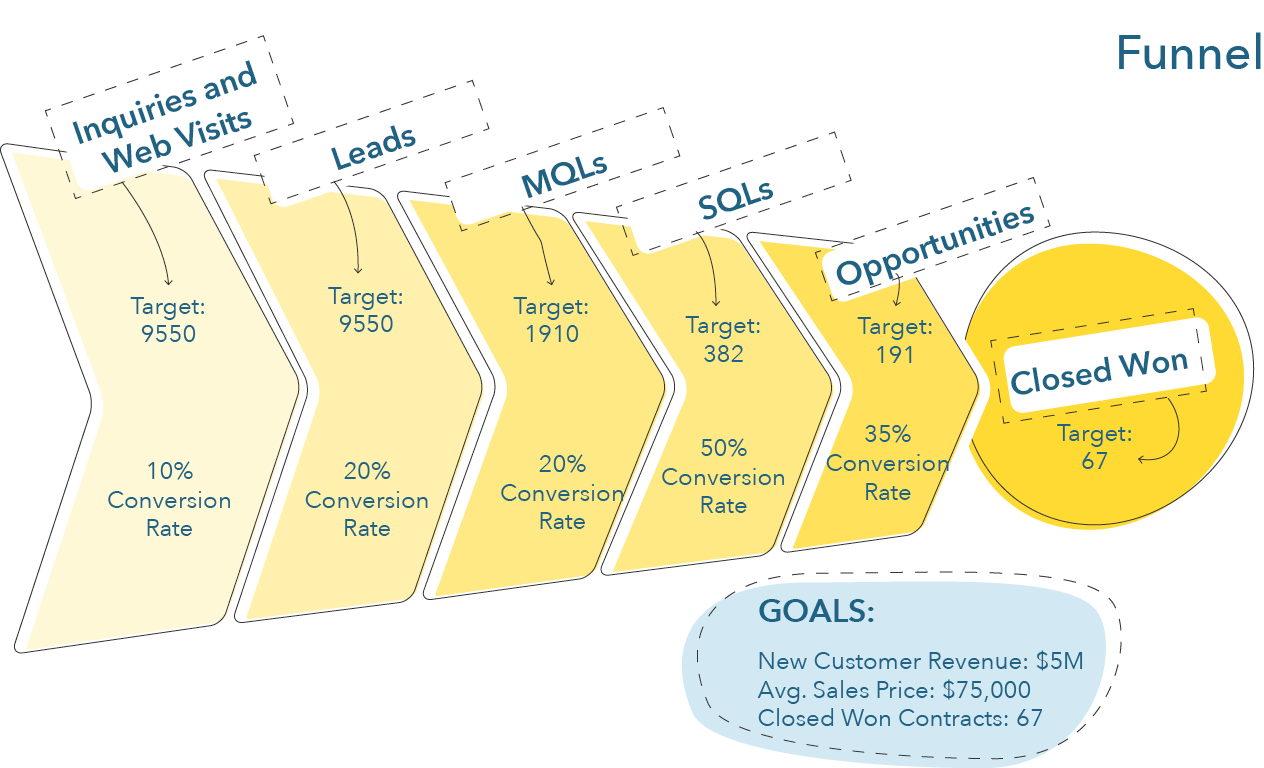
When we look at the journey of consumers this way, we see how, out of all of the visits that we receive on our website, we convert only a fraction to leads. Then, out of all of these leads, only a fraction will be marketing qualified. We then market to these leads and engage in lead nurturing, and only a fraction will move forward in their journey and become sales qualified. Lastly, from these SQLs, only a fraction will become our customers. Each of these moments, where a person moves from one stage to another, might need our attention. Is our conversion rate from visitor to lead good? What about our conversion rate from SQL to customer?
Looking at the performance of a firm throughout its efforts associated with the consumer journey and what happens between the different that stages a consumer goes through (i.e., visitor, lead, customer, and engaged customer) is a good first step to identify exactly where a firm should deploy optimization efforts.
Once a firm understands which steps in the journey seem to be a bottleneck to acquiring customers, it can concentrate on optimizing the specific elements of that step (e.g., a landing page, a shopping cart, or a product page). Using software such as Google Analytics, firms can set up steps for users to achieve on specific pages and measure whether users are going through these steps. For each goal, firms can link a series of steps to create conversion funnels (here is an example for cart abandonment). An example of a funnel for the goal of buying a product could be the following:
Homepage > [Step: Click on shop now] > Product categories page > [Step: Click on a category] > Specific product category > [Step: Click on a product] > Product page > [Step: Click “buy now”] > Checkout page > [Step: Fill out form] > [Step: Buy product]
Analytics solutions then give output that shows the percentage of people that achieve each step. For example, an example of Google’s conversion funnel is shown in Figure 8.3.
Figure 8.3 Google’s Conversion Funnel Example
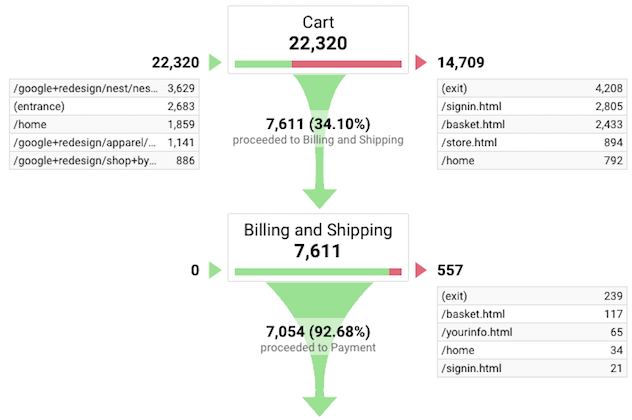
This figure provides a few key pieces of information. On the top left, we see that 22 320 people reached the cart and that 14 709 exited the funnel at this stage. 7 611 entered the funnel and move to the billing and shipping page, or about 34% of the people who reached the funnel. The bar in the ‘cart’ box represents this percentage visually. On the top right, we see that, out of the 14 709 who exited the funnel, 4 208 visitors left the website, 2 805 moved to the sign-in page, 2 433 moved to the basket page, 894 went to the store page, and 792 went back to the home page. We can infer from this that many users wanted to sign in, perhaps to benefit from a loyalty program (e.g., they will accumulate points on their purchase) or some promotion (e.g., free shipping for members). Consumers who return to the basket or the store might be undecided about their overall order and want to add or remove items. Consumers who exited the website, though, might be seen as worrisome, and there might be activities to deploy here (e.g., retargeting ads, abandoned cart email). It also serves to identify an area for conversion improvement to minimize consumers who exit the website after having put items in their cart. Next, we see that, out of the 7 611 users who reached the billing and shipping page, almost all (93%) completed their transactions. This points to a well-optimized billing and shipping page.
No Comments